## Line Chart: Training Metrics Over Time
### Overview
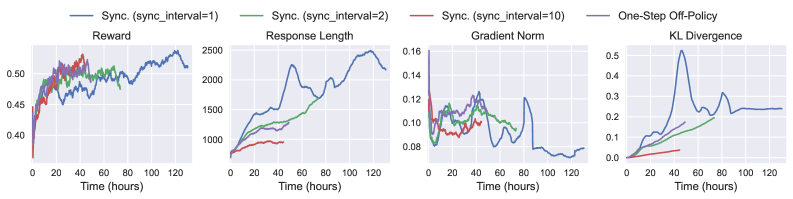
The image presents four line charts arranged horizontally, displaying training metrics over time (in hours). The metrics are Reward, Response Length, Gradient Norm, and KL Divergence. Each chart compares the performance of different synchronization intervals (sync_interval) during training: 1, 2, and 10, as well as a One-Step Off-Policy method.
### Components/Axes
* **X-axis (all charts):** Time (hours), ranging from 0 to 120.
* **Y-axis (Reward):** Reward, ranging from approximately 0.40 to 0.52.
* **Y-axis (Response Length):** Response Length, ranging from approximately 800 to 2500.
* **Y-axis (Gradient Norm):** Gradient Norm, ranging from approximately 0.08 to 0.16.
* **Y-axis (KL Divergence):** KL Divergence, ranging from approximately 0.0 to 0.5.
* **Legend:** Located at the top-right of the image.
* Blue Line: Sync. (sync\_interval=1)
* Green Line: Sync. (sync\_interval=2)
* Red Line: Sync. (sync\_interval=10)
* Black Line: One-Step Off-Policy
### Detailed Analysis or Content Details
**1. Reward Chart:**
* The blue line (sync\_interval=1) starts at approximately 0.46 and generally increases, with fluctuations, reaching around 0.51 at 120 hours.
* The green line (sync\_interval=2) starts at approximately 0.46, increases rapidly to around 0.49 at 20 hours, then plateaus and fluctuates between 0.48 and 0.51.
* The red line (sync\_interval=10) starts at approximately 0.45, increases to around 0.48 at 20 hours, and then fluctuates between 0.47 and 0.50.
* The black line (One-Step Off-Policy) starts at approximately 0.46, increases rapidly to around 0.50 at 20 hours, then decreases to around 0.47 at 40 hours, and then fluctuates between 0.47 and 0.49.
**2. Response Length Chart:**
* The blue line (sync\_interval=1) shows a significant increase from approximately 1000 at 0 hours to around 2400 at 120 hours, with some oscillations.
* The green line (sync\_interval=2) starts at approximately 900 and increases to around 1800 at 120 hours, with a more gradual increase than the blue line.
* The red line (sync\_interval=10) starts at approximately 800 and increases to around 1200 at 120 hours, showing the slowest increase.
* The black line (One-Step Off-Policy) starts at approximately 900 and increases to around 1500 at 120 hours.
**3. Gradient Norm Chart:**
* The blue line (sync\_interval=1) starts at approximately 0.11, decreases to around 0.09 at 20 hours, and then fluctuates between 0.10 and 0.13.
* The green line (sync\_interval=2) starts at approximately 0.10, decreases to around 0.08 at 20 hours, and then fluctuates between 0.09 and 0.12.
* The red line (sync\_interval=10) starts at approximately 0.10, decreases to around 0.08 at 20 hours, and then fluctuates between 0.08 and 0.10.
* The black line (One-Step Off-Policy) starts at approximately 0.11, decreases to around 0.09 at 20 hours, and then fluctuates between 0.09 and 0.11.
**4. KL Divergence Chart:**
* The blue line (sync\_interval=1) starts at approximately 0.05, increases to around 0.25 at 20 hours, and then fluctuates between 0.20 and 0.35.
* The green line (sync\_interval=2) starts at approximately 0.02, increases to around 0.15 at 20 hours, and then fluctuates between 0.10 and 0.20.
* The red line (sync\_interval=10) starts at approximately 0.01, increases to around 0.08 at 20 hours, and then fluctuates between 0.05 and 0.10.
* The black line (One-Step Off-Policy) starts at approximately 0.03, increases to around 0.20 at 20 hours, and then fluctuates between 0.15 and 0.30.
### Key Observations
* The Response Length generally increases with time for all methods, but the rate of increase varies significantly. Sync. (sync\_interval=1) shows the fastest increase.
* The Gradient Norm remains relatively stable across all methods, with minor fluctuations.
* The KL Divergence increases rapidly in the initial phase (0-20 hours) for all methods, then stabilizes. Sync. (sync\_interval=10) exhibits the lowest KL Divergence.
* Reward values are relatively similar across all methods, with some fluctuations.
### Interpretation
The charts demonstrate the impact of different synchronization intervals on the training process. A smaller sync\_interval (1 or 2) leads to faster increases in Response Length and Reward, but also higher KL Divergence, potentially indicating a more unstable learning process. A larger sync\_interval (10) results in slower increases but lower KL Divergence, suggesting a more stable, but potentially slower, learning process. The One-Step Off-Policy method shows intermediate behavior.
The relationship between these metrics suggests a trade-off between learning speed and stability. Faster learning (higher sync\_interval) may lead to instability (higher KL Divergence), while slower learning (lower sync\_interval) may be more stable. The optimal sync\_interval likely depends on the specific application and desired balance between these factors. The Gradient Norm remaining relatively constant suggests that the learning rate is well-tuned across all methods.