## Diagram: Bayesian Network
### Overview
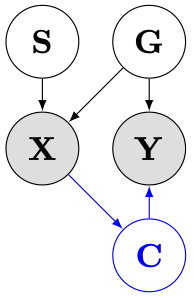
The image depicts a Bayesian network diagram with four nodes (S, G, X, Y, C) and directed edges representing probabilistic dependencies. Nodes X and Y are shaded, indicating they are observed variables, while nodes S, G, and C are unshaded, indicating they are latent variables.
### Components/Axes
* **Nodes:**
* S: Top-left, unshaded circle.
* G: Top-right, unshaded circle.
* X: Middle-left, shaded circle.
* Y: Middle-right, shaded circle.
* C: Bottom-center, unshaded circle, blue outline and text.
* **Edges:**
* S -> X: Directed edge from S to X.
* G -> X: Directed edge from G to X.
* G -> Y: Directed edge from G to Y.
* X -> C: Directed edge from X to C (blue).
* Y -> C: Directed edge from Y to C (blue).
### Detailed Analysis
The diagram shows the following dependencies:
* X depends on S and G.
* Y depends on G.
* C depends on X and Y.
The shading of nodes X and Y indicates that these variables are observed or known, while S, G, and C are unobserved or latent. The blue edges connecting X and Y to C may indicate a specific type of relationship or influence.
### Key Observations
* Nodes X and Y are observed, while S, G, and C are latent.
* Node C is influenced by both X and Y.
* Node G influences both X and Y.
### Interpretation
This Bayesian network represents a probabilistic model where the value of variable C is influenced by the observed variables X and Y, as well as the latent variables S and G. The diagram suggests that S and G are upstream causes that influence X and Y, which in turn influence C. The blue color of the edges leading to C might indicate a specific type of causal relationship or intervention. The model could be used to infer the values of the latent variables S, G, and C given observations of X and Y, or to predict the value of C given values of X and Y.