\n
## Bar Chart: Prediction Flip Rate for Mistral Models
### Overview
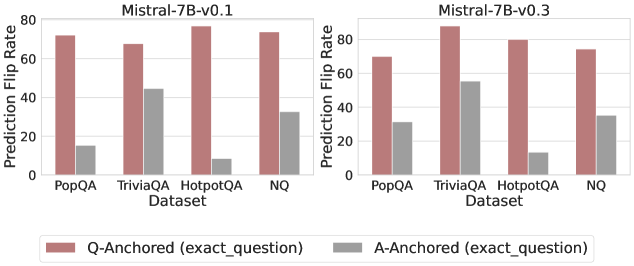
This image presents a comparative bar chart illustrating the Prediction Flip Rate for two versions of the Mistral language model (Mistral-7B-v0.1 and Mistral-7B-v0.3) across four different datasets: PopQA, TriviaQA, HotpotQA, and NQ. The flip rate is measured for both "Q-Anchored (exact_question)" and "A-Anchored (exact_question)" scenarios.
### Components/Axes
* **X-axis:** Dataset - PopQA, TriviaQA, HotpotQA, NQ.
* **Y-axis:** Prediction Flip Rate - Scale ranges from 0 to 80.
* **Models:** Two models are compared: Mistral-7B-v0.1 and Mistral-7B-v0.3. Each model has its own chart.
* **Anchoring:** Two anchoring methods are compared within each dataset:
* Q-Anchored (exact\_question) - Represented by a reddish-brown color.
* A-Anchored (exact\_question) - Represented by a gray color.
* **Legend:** Located at the bottom-center of the image, it clearly defines the color coding for each anchoring method.
### Detailed Analysis or Content Details
**Mistral-7B-v0.1 Chart:**
* **PopQA:**
* Q-Anchored: Approximately 72.
* A-Anchored: Approximately 16.
* **TriviaQA:**
* Q-Anchored: Approximately 68.
* A-Anchored: Approximately 44.
* **HotpotQA:**
* Q-Anchored: Approximately 78.
* A-Anchored: Approximately 10.
* **NQ:**
* Q-Anchored: Approximately 74.
* A-Anchored: Approximately 32.
**Mistral-7B-v0.3 Chart:**
* **PopQA:**
* Q-Anchored: Approximately 64.
* A-Anchored: Approximately 28.
* **TriviaQA:**
* Q-Anchored: Approximately 80.
* A-Anchored: Approximately 48.
* **HotpotQA:**
* Q-Anchored: Approximately 76.
* A-Anchored: Approximately 14.
* **NQ:**
* Q-Anchored: Approximately 70.
* A-Anchored: Approximately 36.
In both charts, the Q-Anchored bars are consistently higher than the A-Anchored bars across all datasets.
### Key Observations
* The Q-Anchored flip rate is significantly higher than the A-Anchored flip rate for all datasets and both models.
* The HotpotQA dataset consistently shows the highest Q-Anchored flip rate for both models.
* The A-Anchored flip rate is generally low across all datasets, but varies between datasets.
* Mistral-7B-v0.3 generally shows a slightly lower Q-Anchored flip rate compared to Mistral-7B-v0.1, but a higher A-Anchored flip rate in some datasets.
### Interpretation
The data suggests that anchoring the prediction flip rate calculation to the exact question (Q-Anchored) results in a much higher flip rate compared to anchoring it to the exact answer (A-Anchored). This indicates that the model is more sensitive to changes in the question phrasing than changes in the answer. The higher flip rates observed on the HotpotQA dataset might suggest that this dataset presents more challenging or ambiguous questions. The slight differences between the two model versions (v0.1 and v0.3) suggest that model updates have a subtle impact on prediction stability, potentially improving robustness to answer variations while maintaining sensitivity to question variations. The large difference between Q and A anchored rates suggests that the model is more likely to change its prediction when the question is altered, even if the correct answer remains the same. This could be due to the model's reliance on specific keywords or phrasing in the question.