\n
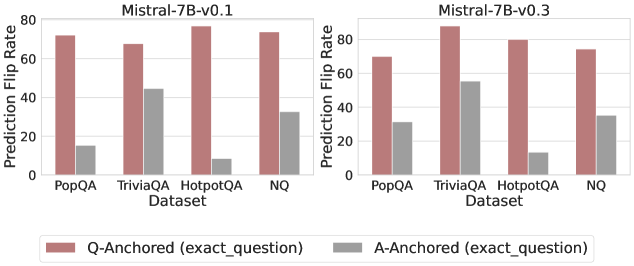
## Grouped Bar Chart: Prediction Flip Rate by Dataset and Anchoring Method
### Overview
The image displays two side-by-side grouped bar charts comparing the "Prediction Flip Rate" for two versions of the Mistral-7B model (v0.1 and v0.3) across four question-answering datasets. The charts analyze the sensitivity of model predictions to the anchoring method used in the prompt.
### Components/Axes
* **Chart Titles:**
* Left Chart: `Mistral-7B-v0.1`
* Right Chart: `Mistral-7B-v0.3`
* **Y-Axis (Both Charts):**
* Label: `Prediction Flip Rate`
* Scale: 0 to 80, with major tick marks at 0, 20, 40, 60, 80.
* **X-Axis (Both Charts):**
* Label: `Dataset`
* Categories (from left to right): `PopQA`, `TriviaQA`, `HotpotQA`, `NQ`.
* **Legend (Bottom Center):**
* A red/brown bar labeled: `Q-Anchored (exact_question)`
* A grey bar labeled: `A-Anchored (exact_question)`
### Detailed Analysis
The data is presented as pairs of bars for each dataset, one for each anchoring method.
**For Mistral-7B-v0.1 (Left Chart):**
* **PopQA:** Q-Anchored bar is high (~72). A-Anchored bar is low (~15).
* **TriviaQA:** Q-Anchored bar is high (~68). A-Anchored bar is moderate (~45).
* **HotpotQA:** Q-Anchored bar is the highest (~78). A-Anchored bar is very low (~8).
* **NQ:** Q-Anchored bar is high (~74). A-Anchored bar is moderate (~33).
**For Mistral-7B-v0.3 (Right Chart):**
* **PopQA:** Q-Anchored bar is high (~70). A-Anchored bar is moderate (~32).
* **TriviaQA:** Q-Anchored bar is the highest (~86). A-Anchored bar is moderate-high (~55).
* **HotpotQA:** Q-Anchored bar is high (~80). A-Anchored bar is low (~13).
* **NQ:** Q-Anchored bar is high (~75). A-Anchored bar is moderate (~35).
**Visual Trend Verification:**
* In both model versions, the **Q-Anchored (red/brown) bars are consistently and significantly higher** than the A-Anchored (grey) bars for every dataset.
* The **A-Anchored bars show more variability** across datasets compared to the relatively stable high values of the Q-Anchored bars.
* Comparing model versions, the **Q-Anchored rates remain similarly high**. The **A-Anchored rates appear to increase slightly** from v0.1 to v0.3 for PopQA and TriviaQA, while remaining similarly low for HotpotQA and similar for NQ.
### Key Observations
1. **Dominant Anchoring Effect:** The choice of anchoring method (Q-Anchored vs. A-Anchored) has a dramatic impact on the prediction flip rate, far more than the choice of dataset or model version shown here.
2. **Dataset Sensitivity:** The A-Anchored method's flip rate is highly sensitive to the dataset. It is lowest on HotpotQA and highest on TriviaQA in both models.
3. **Model Version Difference:** The primary difference between v0.1 and v0.3 appears to be a moderate increase in the A-Anchored flip rate for the PopQA and TriviaQA datasets, suggesting a change in model behavior for those specific data distributions.
### Interpretation
This data demonstrates a strong **prompt sensitivity** or **anchoring bias** in the Mistral-7B models. The "Prediction Flip Rate" likely measures how often a model's answer changes when the prompt is formatted differently but contains the same core information.
* **Q-Anchored (exact_question):** This method, where the question is precisely anchored in the prompt, leads to a high flip rate (~70-86%). This suggests the model's output is highly volatile and dependent on the exact phrasing of the question, even when the underlying query is identical. It indicates a lack of robustness in reasoning.
* **A-Anchored (exact_question):** This method, where the answer is anchored, results in a lower flip rate (~8-55%). This implies that when the model is prompted with a structure that emphasizes or includes the answer, its outputs are more stable. The lower rate suggests the model may be relying more on pattern matching to the provided answer format rather than independent reasoning.
The stark contrast between the two bars for each dataset highlights a potential vulnerability: the model's responses can be easily manipulated or made inconsistent by simple changes in prompt structure. The variation across datasets for the A-Anchored method further suggests that this stability is not uniform and depends on the nature of the knowledge or reasoning required (e.g., HotpotQA, which involves multi-hop reasoning, shows the lowest A-Anchored stability). The slight increase in A-Anchored flip rates from v0.1 to v0.3 for some datasets could indicate a shift in the model's training or alignment that affects its sensitivity to answer-anchored prompts.