## Bar Chart: Prediction Flip Rate Comparison for Mistral-7B Models (v0.1 vs v0.3)
### Overview
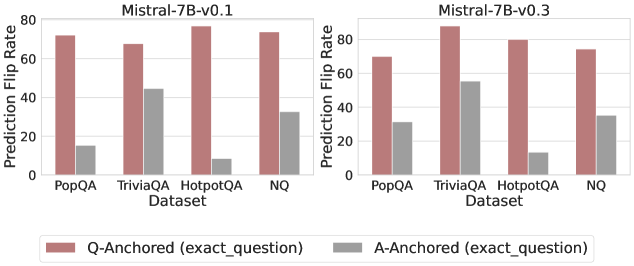
The image presents a side-by-side comparison of prediction flip rates for two versions of the Mistral-7B model (v0.1 and v0.3) across four question-answering datasets: PopQA, TriviaQA, HotpotQA, and NQ. Two categories are compared for each dataset: "Q-Anchored (exact_question)" (red bars) and "A-Anchored (exact_question)" (gray bars). The y-axis represents prediction flip rate (0–80), while the x-axis lists datasets.
### Components/Axes
- **X-Axis (Datasets)**: PopQA, TriviaQA, HotpotQA, NQ (repeated for both model versions).
- **Y-Axis (Prediction Flip Rate)**: Scaled from 0 to 80 in increments of 20.
- **Legend**:
- Red: Q-Anchored (exact_question)
- Gray: A-Anchored (exact_question)
- **Model Versions**:
- Left chart: Mistral-7B-v0.1
- Right chart: Mistral-7B-v0.3
### Detailed Analysis
#### Mistral-7B-v0.1
- **PopQA**:
- Q-Anchored: ~70
- A-Anchored: ~15
- **TriviaQA**:
- Q-Anchored: ~65
- A-Anchored: ~45
- **HotpotQA**:
- Q-Anchored: ~75
- A-Anchored: ~10
- **NQ**:
- Q-Anchored: ~72
- A-Anchored: ~30
#### Mistral-7B-v0.3
- **PopQA**:
- Q-Anchored: ~60
- A-Anchored: ~25
- **TriviaQA**:
- Q-Anchored: ~78
- A-Anchored: ~50
- **HotpotQA**:
- Q-Anchored: ~70
- A-Anchored: ~12
- **NQ**:
- Q-Anchored: ~68
- A-Anchored: ~32
### Key Observations
1. **Q-Anchored Consistently Outperforms A-Anchored**: Across all datasets and models, Q-Anchored (red) bars are significantly taller than A-Anchored (gray) bars, indicating higher prediction flip rates for exact-question anchoring.
2. **Model Version Differences**:
- v0.3 shows slightly lower Q-Anchored rates than v0.1 in PopQA (~60 vs ~70) and NQ (~68 vs ~72), but higher in TriviaQA (~78 vs ~65).
- A-Anchored rates increase modestly in v0.3 (e.g., TriviaQA: ~50 vs ~45).
3. **Dataset-Specific Trends**:
- **HotpotQA**: Lowest A-Anchored rates (~10–12) suggest greater sensitivity to anchoring methods.
- **TriviaQA**: Highest A-Anchored rate in v0.3 (~50), indicating improved performance with this anchoring strategy for this dataset.
### Interpretation
The data demonstrates that anchoring predictions to exact questions (Q-Anchored) generally yields higher flip rates than anchoring to answers (A-Anchored), likely due to the specificity of question-based context. The marginal differences between model versions (v0.1 vs v0.3) suggest that updates to Mistral-7B had limited impact on this metric, though TriviaQA performance improved notably in v0.3. The stark contrast in A-Anchored rates across datasets (e.g., HotpotQA vs TriviaQA) highlights dataset-specific challenges, possibly tied to question complexity or answer ambiguity. These findings underscore the importance of anchoring strategy in model evaluation and the need for dataset-aware tuning.