## Scatter Plot: professional_psychology
### Overview
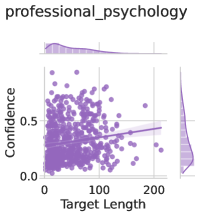
The image is a scatter plot titled "professional_psychology". It displays the relationship between "Target Length" on the x-axis and "Confidence" on the y-axis. The plot includes a regression line with a confidence interval. Histograms are displayed along the top and right edges, showing the distributions of Target Length and Confidence, respectively.
### Components/Axes
* **Title:** professional\_psychology
* **X-axis:** Target Length
* Scale: 0 to approximately 220
* Markers: 0, 100, 200
* **Y-axis:** Confidence
* Scale: 0.0 to 0.5
* Markers: 0.0, 0.5
* **Data Points:** Purple dots scattered across the plot.
* **Regression Line:** A light purple line with a shaded confidence interval.
* **Histograms:**
* Top: Distribution of Target Length
* Right: Distribution of Confidence
### Detailed Analysis
* **Target Length Distribution:** The histogram at the top shows that the majority of target lengths are concentrated between 0 and 100, with a long tail extending to higher values.
* **Confidence Distribution:** The histogram on the right shows that the confidence values are concentrated between 0.0 and 0.5, with a peak around 0.4.
* **Scatter Plot:** The scatter plot shows a weak positive correlation between Target Length and Confidence. Most data points are clustered in the lower-left corner, indicating that shorter target lengths tend to have lower confidence values.
* **Regression Line:** The regression line slopes slightly upward, suggesting a positive relationship between Target Length and Confidence. The confidence interval around the regression line is relatively wide, indicating uncertainty in the relationship.
### Key Observations
* Most data points are clustered at lower target lengths and confidence values.
* There is a weak positive correlation between Target Length and Confidence.
* The confidence interval around the regression line is wide, indicating uncertainty.
### Interpretation
The scatter plot suggests that there is a weak positive relationship between Target Length and Confidence in the context of "professional_psychology". This means that, on average, as the target length increases, the confidence also tends to increase slightly. However, the wide confidence interval and the clustering of data points indicate that this relationship is not very strong or consistent. The distributions of Target Length and Confidence show that shorter target lengths and lower confidence values are more common in the dataset.