\n
## Scatter Plot with Marginal Distributions: Professional Psychology Confidence vs. Target Length
### Overview
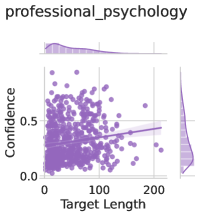
The image displays a scatter plot analyzing the relationship between "Target Length" and "Confidence" within the domain of "professional_psychology." The plot includes a fitted trend line and marginal distribution plots (histograms/density plots) for both variables, providing a comprehensive view of the data's distribution and correlation.
### Components/Axes
* **Title:** "professional_psychology" (located at the top center).
* **Main Chart Area:** A scatter plot with a fitted linear trend line.
* **X-Axis:**
* **Label:** "Target Length"
* **Scale:** Linear, ranging from 0 to over 200.
* **Major Tick Marks:** 0, 100, 200.
* **Y-Axis:**
* **Label:** "Confidence"
* **Scale:** Linear, ranging from 0.0 to approximately 0.7.
* **Major Tick Marks:** 0.0, 0.5.
* **Data Series:** A single series represented by purple circular points.
* **Trend Line:** A solid purple line indicating the linear regression fit.
* **Marginal Plots:**
* **Top Marginal Plot:** A distribution plot (likely a histogram or kernel density estimate) for the "Target Length" variable, aligned with the x-axis.
* **Right Marginal Plot:** A distribution plot for the "Confidence" variable, aligned with the y-axis.
* **Legend:** No explicit legend is present. The consistent purple color for all points and the trend line implies they belong to a single data category.
### Detailed Analysis
* **Data Distribution (Scatter Plot):**
* The data points (purple dots) are densely clustered in the lower-left quadrant of the plot.
* The highest density of points occurs approximately within the range of **Target Length: 0 to 150** and **Confidence: 0.0 to 0.4**.
* There is a visible, positive linear trend. As "Target Length" increases, "Confidence" shows a general tendency to increase.
* **Trend Line:** The purple regression line starts at approximately **(Target Length ≈ 0, Confidence ≈ 0.1)** and slopes upward to approximately **(Target Length ≈ 200, Confidence ≈ 0.4)**.
* **Outliers/Variability:** Several data points exist with relatively high confidence (>0.5) across various target lengths. Conversely, some points with long target lengths (>150) have low confidence (<0.2). The spread of points around the trend line indicates moderate variability.
* **Marginal Distributions:**
* **Target Length (Top Plot):** The distribution is right-skewed. The peak (mode) appears to be in the range of approximately **50-100**. The tail extends beyond 200.
* **Confidence (Right Plot):** The distribution appears roughly unimodal and slightly left-skewed. The peak is centered around **0.2-0.3**. The density tapers off towards 0.0 and 0.6.
### Key Observations
1. **Positive Correlation:** The primary observation is a positive association between target length and confidence in the context of professional psychology.
2. **Data Concentration:** Most analyzed instances involve relatively short target lengths (under 150) and low-to-moderate confidence scores (under 0.4).
3. **Variability:** The relationship is not deterministic. For any given target length, there is a substantial range of confidence values, indicating other factors are at play.
4. **Distribution Shapes:** The target length data is not normally distributed but is concentrated at lower values with a long tail. Confidence scores are more centrally clustered.
### Interpretation
The data suggests that within the sampled professional psychology materials or tasks, there is a measurable, positive relationship between the length of a target (which could refer to a text passage, a case description, or a therapeutic goal) and the confidence associated with it (which could be a clinician's confidence in a diagnosis, a prediction, or an intervention outcome).
* **What it Demonstrates:** Longer targets may provide more information or context, leading to slightly higher confidence. However, the moderate slope and significant scatter indicate that length alone is a weak-to-moderate predictor of confidence. Expertise, target complexity, or data quality are likely stronger, unmeasured factors.
* **Notable Anomaly:** The presence of high-confidence points at short target lengths is interesting. These could represent clear-cut, prototypical cases where little information is needed for high confidence. Conversely, low-confidence points at long lengths might represent complex, ambiguous, or contradictory information that does not resolve uncertainty.
* **Underlying Pattern:** The right-skewed distribution of target length implies that most professional psychology targets in this dataset are concise, with fewer very long ones. The analysis focuses on the relationship within this common range. The plot effectively argues against a simplistic "more information always equals more confidence" model, highlighting the nuanced nature of judgment in the field.