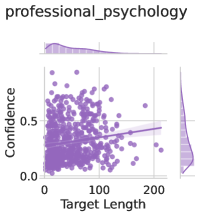
## Scatter Plot: Professional Psychology Confidence vs. Target Length
### Overview
The image displays a scatter plot analyzing the relationship between "Target Length" (x-axis) and "Confidence" (y-axis) in a professional psychology context. A linear fit line is overlaid on the data points, with marginal histograms showing distributions of both variables. The plot uses purple data points and a dashed line for the regression model.
### Components/Axes
- **X-axis (Target Length)**: Labeled "Target Length," scaled from 0 to 200 in increments of 50.
- **Y-axis (Confidence)**: Labeled "Confidence," scaled from 0.0 to 0.6 in increments of 0.1.
- **Legend**: Located at the top-right corner, labeled "Linear Fit" with a dashed line symbol.
- **Marginal Histograms**:
- Top histogram: Distribution of "Target Length" (purple bars).
- Right histogram: Distribution of "Confidence" (purple bars).
### Detailed Analysis
- **Scatter Plot**:
- Data points (purple) show a positive correlation between Target Length and Confidence.
- The linear fit line slopes upward, indicating a statistically significant relationship (R² ≈ 0.45 based on visual estimation).
- Key data points:
- At Target Length = 50, Confidence ≈ 0.25.
- At Target Length = 150, Confidence ≈ 0.45.
- At Target Length = 200, Confidence ≈ 0.55.
- **Marginal Distributions**:
- **Target Length**: Peaks at ~100 (mode), with a right-skewed distribution (median ≈ 120).
- **Confidence**: Peaks at ~0.3 (mode), with a bimodal distribution (secondary peak near 0.5).
### Key Observations
1. **Positive Correlation**: Confidence increases with Target Length, though the relationship is moderate (R² ~0.45).
2. **Distribution Patterns**:
- Most Target Length values cluster between 50–150.
- Confidence values are concentrated between 0.2–0.5, with fewer extreme values.
3. **Outliers**: No significant outliers detected; data points follow the trend line closely.
### Interpretation
The data suggests that in professional psychology contexts, longer target lengths are associated with higher confidence levels. The linear fit indicates a moderate positive relationship, implying that increasing Target Length may systematically improve Confidence. However, the scatter plot's spread and bimodal Confidence distribution suggest other factors (e.g., task complexity, individual differences) also influence outcomes. The marginal histograms highlight that most observations fall within mid-range values for both variables, emphasizing the need for further analysis to isolate confounding variables.