## Line Chart: Pass@k(%) vs. Number of Sample k
### Overview
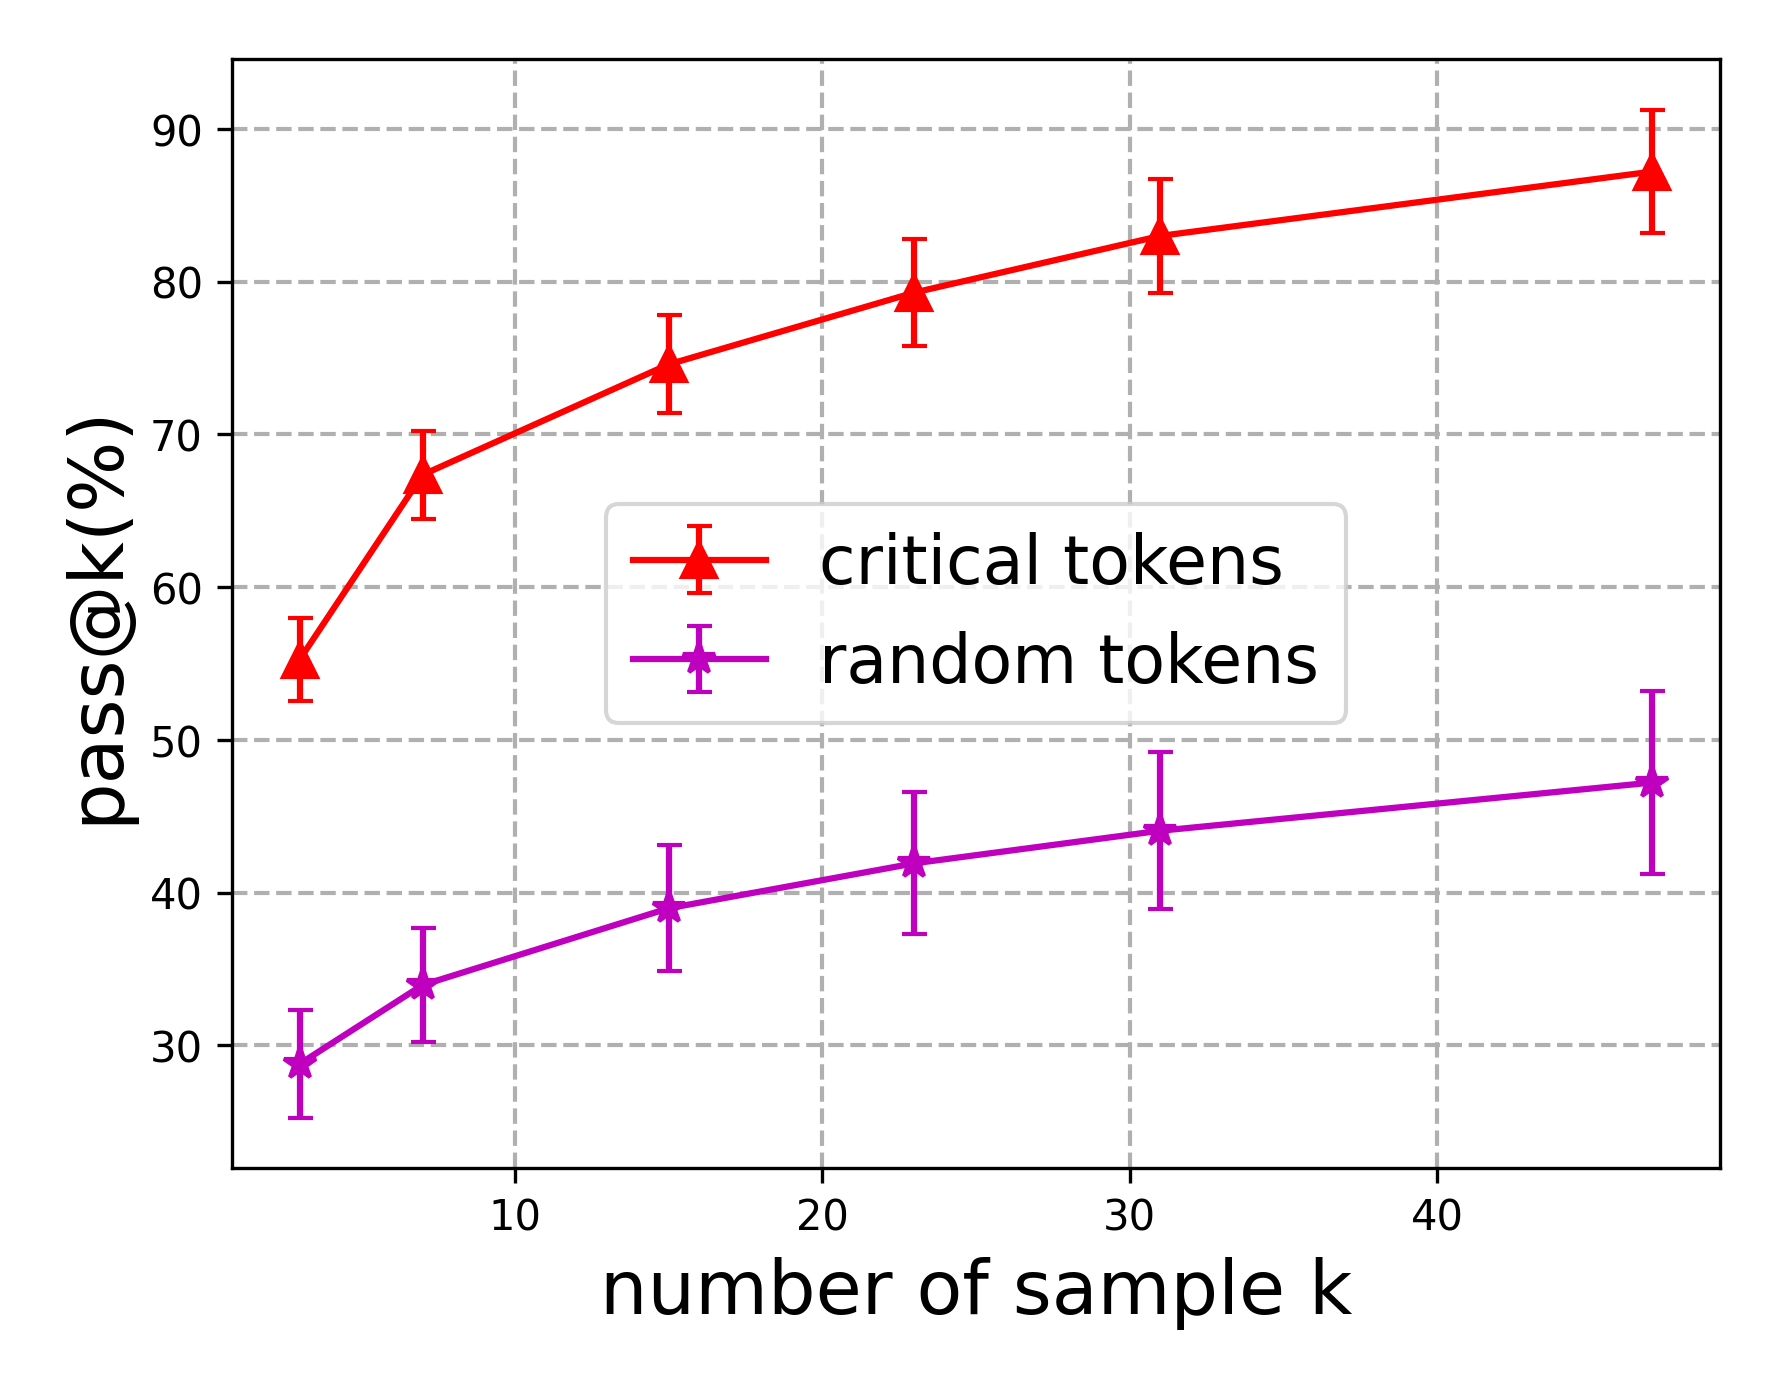
The image is a line chart comparing the performance of "critical tokens" and "random tokens" based on the "pass@k(%)" metric, as the "number of sample k" increases. The chart includes error bars for each data point, indicating variability.
### Components/Axes
* **X-axis:** "number of sample k" with tick marks at 10, 20, 30, and 40.
* **Y-axis:** "pass@k(%)" with tick marks at 30, 40, 50, 60, 70, 80, and 90.
* **Legend:** Located in the center of the chart.
* Red line with triangle markers: "critical tokens"
* Purple line with plus markers: "random tokens"
### Detailed Analysis
* **Critical Tokens (Red Line):** The line slopes upward, indicating an increase in "pass@k(%)" as the "number of sample k" increases.
* At k=5, pass@k(%) is approximately 57% (with an error range of +/- 3%).
* At k=15, pass@k(%) is approximately 75% (with an error range of +/- 3%).
* At k=25, pass@k(%) is approximately 80% (with an error range of +/- 3%).
* At k=30, pass@k(%) is approximately 83% (with an error range of +/- 3%).
* At k=45, pass@k(%) is approximately 87% (with an error range of +/- 4%).
* **Random Tokens (Purple Line):** The line also slopes upward, but at a shallower angle compared to the "critical tokens" line.
* At k=5, pass@k(%) is approximately 30% (with an error range of +/- 3%).
* At k=15, pass@k(%) is approximately 40% (with an error range of +/- 3%).
* At k=25, pass@k(%) is approximately 42% (with an error range of +/- 3%).
* At k=30, pass@k(%) is approximately 45% (with an error range of +/- 4%).
* At k=45, pass@k(%) is approximately 47% (with an error range of +/- 6%).
### Key Observations
* The "critical tokens" consistently outperform "random tokens" across all values of k.
* The performance gap between "critical tokens" and "random tokens" widens as k increases, but the rate of increase slows down for both.
* The error bars suggest that the variability in "pass@k(%)" is relatively consistent across different values of k for both token types.
### Interpretation
The data suggests that using "critical tokens" leads to a significantly higher "pass@k(%)" compared to using "random tokens." This indicates that "critical tokens" are more effective in achieving the desired outcome, whatever that may be. The increasing performance with higher k values suggests that increasing the number of samples improves the overall performance for both token types, but the effect is more pronounced for "critical tokens." The error bars provide a measure of confidence in these observations, suggesting that the observed differences are statistically significant. The flattening of the curves at higher k values might indicate a point of diminishing returns, where increasing the number of samples provides less and less improvement in performance.