## Line Chart: pass@k(%) vs. number of sample k
### Overview
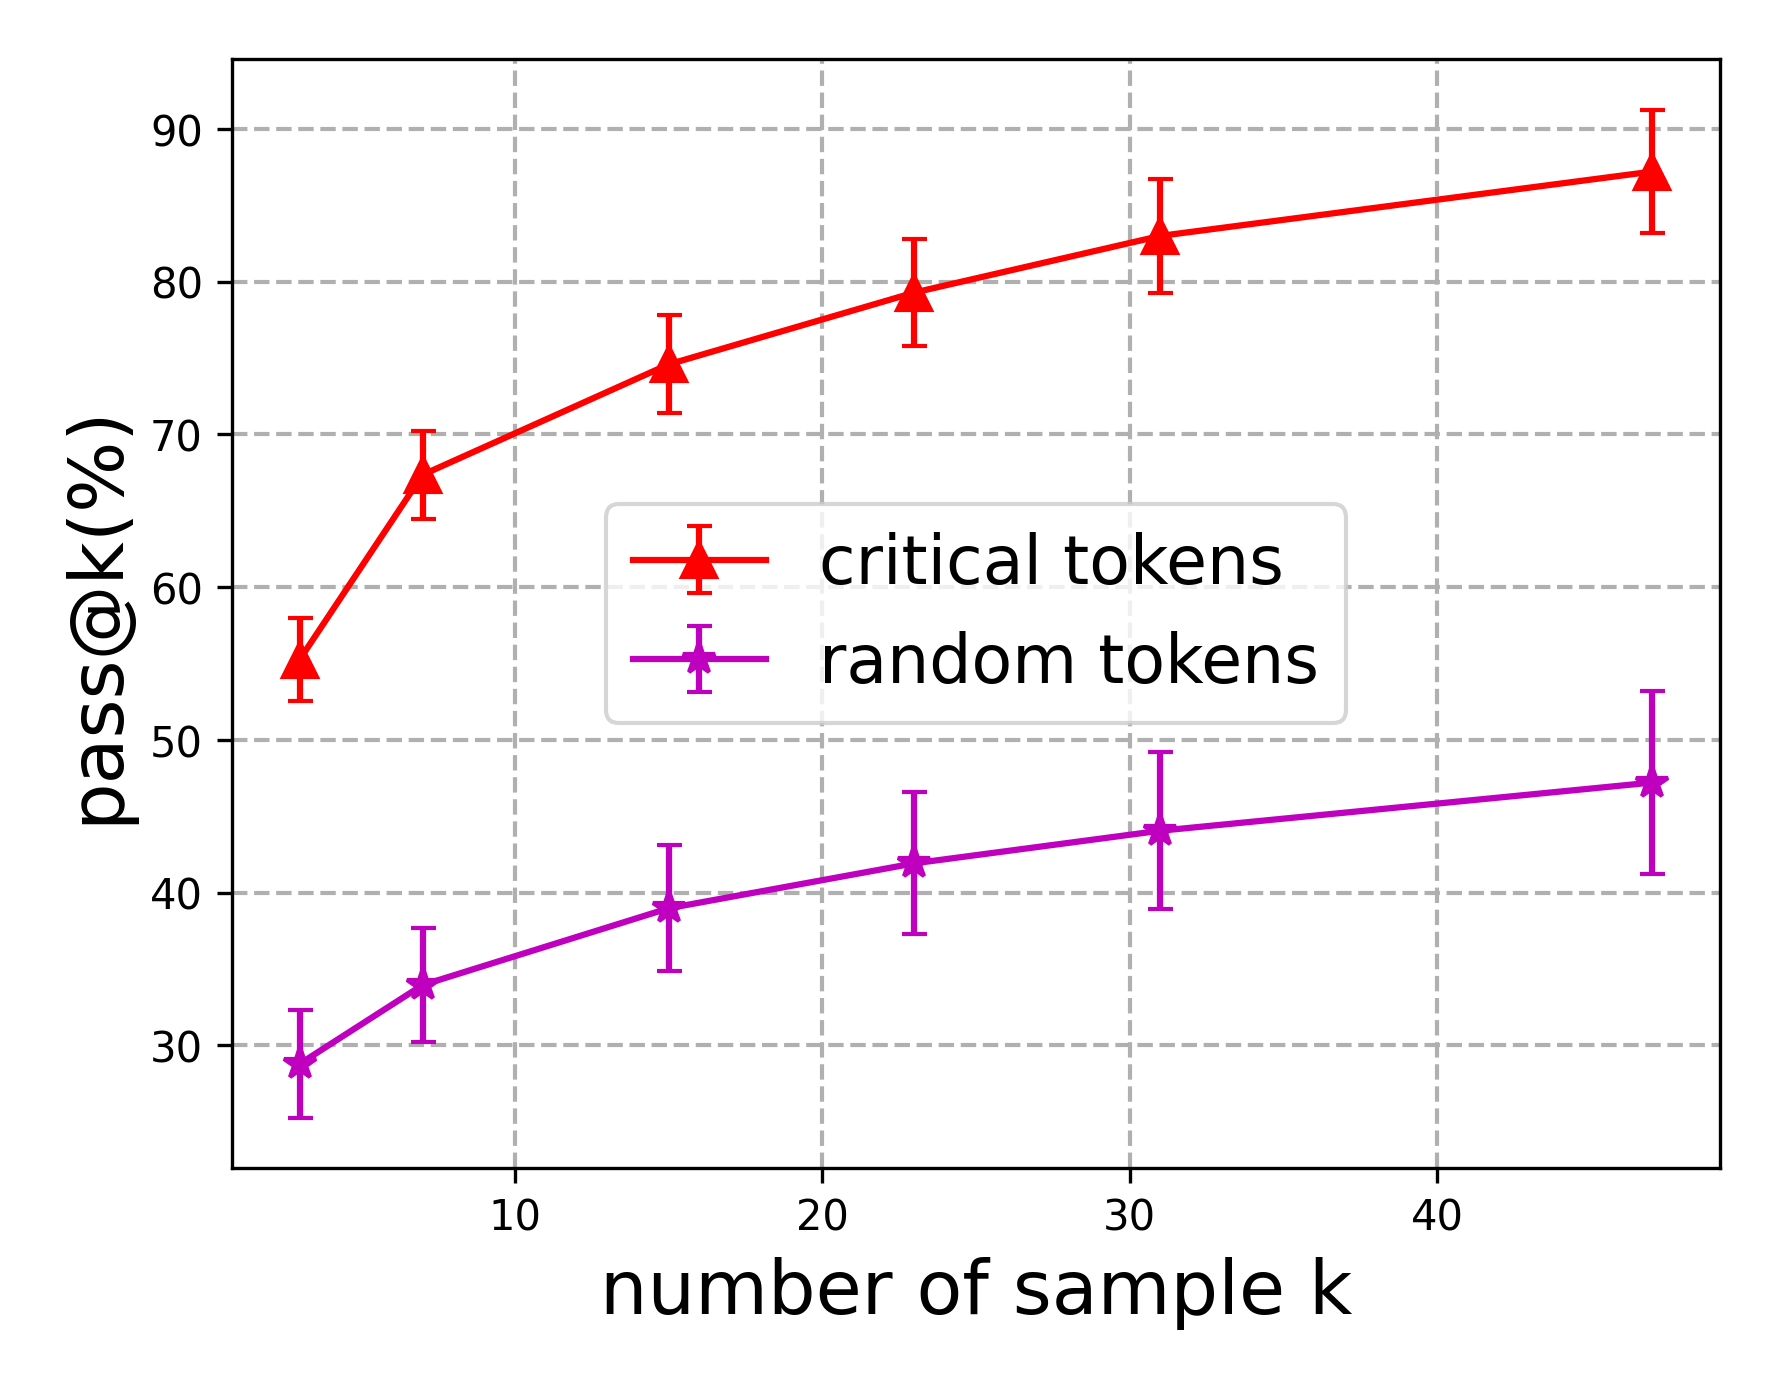
The image is a line chart with error bars, plotting the performance metric "pass@k(%)" against the "number of sample k". It compares two distinct methods or conditions: "critical tokens" and "random tokens". The chart demonstrates how the pass rate changes as the number of samples (k) increases for each condition.
### Components/Axes
* **Chart Type:** Line chart with error bars.
* **X-Axis:**
* **Label:** `number of sample k`
* **Scale:** Linear scale from approximately 0 to 50.
* **Major Tick Marks:** 10, 20, 30, 40.
* **Y-Axis:**
* **Label:** `pass@k(%)`
* **Scale:** Linear scale from approximately 25 to 95.
* **Major Tick Marks:** 30, 40, 50, 60, 70, 80, 90.
* **Legend:**
* **Position:** Centered within the plot area, slightly to the right.
* **Entry 1:** Red line with upward-pointing triangle markers, labeled `critical tokens`.
* **Entry 2:** Purple (magenta) line with star markers, labeled `random tokens`.
* **Grid:** Dashed gray grid lines are present for both major x and y ticks.
### Detailed Analysis
**Data Series 1: critical tokens (Red line, triangle markers)**
* **Trend:** The line shows a steep, concave-down increase. The rate of improvement in pass@k is highest for small k and gradually diminishes as k increases.
* **Data Points (Approximate with Error Bar Ranges):**
* k ≈ 5: pass@k ≈ 55% (Error bar range: ~53% to ~57%)
* k ≈ 8: pass@k ≈ 67% (Error bar range: ~65% to ~70%)
* k ≈ 15: pass@k ≈ 75% (Error bar range: ~72% to ~78%)
* k ≈ 23: pass@k ≈ 79% (Error bar range: ~76% to ~83%)
* k ≈ 31: pass@k ≈ 83% (Error bar range: ~80% to ~87%)
* k ≈ 47: pass@k ≈ 87% (Error bar range: ~83% to ~91%)
**Data Series 2: random tokens (Purple line, star markers)**
* **Trend:** The line shows a steady, nearly linear increase. The slope is positive but significantly shallower than the "critical tokens" series.
* **Data Points (Approximate with Error Bar Ranges):**
* k ≈ 5: pass@k ≈ 29% (Error bar range: ~26% to ~32%)
* k ≈ 8: pass@k ≈ 34% (Error bar range: ~30% to ~38%)
* k ≈ 15: pass@k ≈ 39% (Error bar range: ~35% to ~43%)
* k ≈ 23: pass@k ≈ 42% (Error bar range: ~38% to ~47%)
* k ≈ 31: pass@k ≈ 44% (Error bar range: ~39% to ~49%)
* k ≈ 47: pass@k ≈ 47% (Error bar range: ~41% to ~53%)
### Key Observations
1. **Performance Gap:** There is a substantial and consistent performance gap between the two methods. "Critical tokens" achieves a pass@k rate approximately 25-40 percentage points higher than "random tokens" across all measured values of k.
2. **Diminishing Returns:** The "critical tokens" series exhibits clear diminishing returns. The gain from k=5 to k=8 (~12%) is much larger than the gain from k=31 to k=47 (~4%). The "random tokens" series shows more constant, linear returns.
3. **Error Bar Magnitude:** The error bars (representing uncertainty or variance) for both series appear to increase slightly in absolute terms as k increases. The relative uncertainty (error bar size compared to the mean value) seems more stable.
4. **Convergence:** The two lines are not converging. The absolute difference in pass@k between them remains large even at the highest k value shown (k≈47).
### Interpretation
This chart likely comes from a machine learning or natural language processing context, evaluating a model's ability to generate correct outputs (pass@k) given a certain number of sampling attempts (k). The "critical tokens" method appears to be a targeted or informed strategy for guiding generation, while "random tokens" represents a baseline or unguided approach.
The data strongly suggests that **strategically selecting or influencing "critical tokens" is a far more effective strategy for improving model performance than relying on random sampling.** The steep initial rise for critical tokens indicates that even a small number of guided samples yields a high probability of success. The persistent gap shows that the advantage of the guided method does not diminish with more attempts; it maintains a superior efficiency. The linear trend for random tokens is characteristic of a baseline where each additional sample provides a roughly equal, independent chance of success. The chart effectively argues for the value of the "critical tokens" intervention.