## Line Graphs: Mistral-7B Model Performance Comparison
### Overview
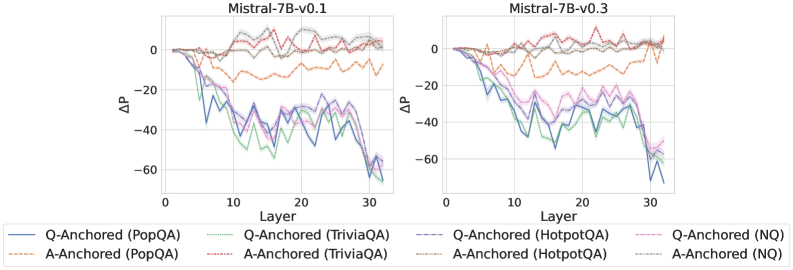
The image presents two line graphs comparing the performance of Mistral-7B models (v0.1 and v0.3) across different layers and question-answering datasets. The graphs depict the change in performance (ΔP) as a function of the layer number, with separate lines for question-anchored (Q-Anchored) and answer-anchored (A-Anchored) approaches on various datasets.
### Components/Axes
* **Titles:**
* Left Graph: "Mistral-7B-v0.1"
* Right Graph: "Mistral-7B-v0.3"
* **Y-Axis:**
* Label: "ΔP" (Change in Performance)
* Scale: -60 to 0, with tick marks at -40, -20, and 0.
* **X-Axis:**
* Label: "Layer"
* Scale: 0 to 30, with tick marks every 10 units.
* **Legend:** Located at the bottom of the image, spanning both graphs.
* **Q-Anchored (PopQA):** Solid Blue Line
* **A-Anchored (PopQA):** Dashed Brown Line
* **Q-Anchored (TriviaQA):** Dotted Green Line
* **A-Anchored (TriviaQA):** Dotted-Dashed Pink Line
* **Q-Anchored (HotpotQA):** Dash-Dot Blue Line
* **A-Anchored (HotpotQA):** Solid Green Line
* **Q-Anchored (NQ):** Dotted-Dashed Pink Line
* **A-Anchored (NQ):** Dotted Black Line
### Detailed Analysis
**Left Graph (Mistral-7B-v0.1):**
* **Q-Anchored (PopQA):** (Solid Blue Line) Starts at 0, decreases sharply to approximately -40 by layer 10, fluctuates between -30 and -50 until layer 30, and ends around -60.
* **A-Anchored (PopQA):** (Dashed Brown Line) Starts at 0, decreases to approximately -10 by layer 10, and then remains relatively stable between -10 and -5 until layer 30.
* **Q-Anchored (TriviaQA):** (Dotted Green Line) Starts at 0, decreases sharply to approximately -30 by layer 10, fluctuates between -30 and -50 until layer 30, and ends around -60.
* **A-Anchored (TriviaQA):** (Dotted-Dashed Pink Line) Starts at 0, decreases sharply to approximately -30 by layer 10, fluctuates between -30 and -40 until layer 30, and ends around -50.
* **Q-Anchored (HotpotQA):** (Dash-Dot Blue Line) Starts at 0, decreases sharply to approximately -30 by layer 10, fluctuates between -30 and -40 until layer 30, and ends around -50.
* **A-Anchored (HotpotQA):** (Solid Green Line) Starts at 0, decreases sharply to approximately -30 by layer 10, fluctuates between -30 and -40 until layer 30, and ends around -50.
* **Q-Anchored (NQ):** (Dotted-Dashed Pink Line) Starts at 0, decreases sharply to approximately -30 by layer 10, fluctuates between -30 and -40 until layer 30, and ends around -50.
* **A-Anchored (NQ):** (Dotted Black Line) Starts at 0, increases to approximately 10 by layer 10, and then remains relatively stable between 10 and 5 until layer 30.
**Right Graph (Mistral-7B-v0.3):**
* **Q-Anchored (PopQA):** (Solid Blue Line) Starts at 0, decreases sharply to approximately -40 by layer 10, fluctuates between -30 and -50 until layer 30, and ends around -60.
* **A-Anchored (PopQA):** (Dashed Brown Line) Starts at 0, decreases to approximately -10 by layer 10, and then remains relatively stable between -10 and -5 until layer 30.
* **Q-Anchored (TriviaQA):** (Dotted Green Line) Starts at 0, decreases sharply to approximately -30 by layer 10, fluctuates between -30 and -50 until layer 30, and ends around -60.
* **A-Anchored (TriviaQA):** (Dotted-Dashed Pink Line) Starts at 0, decreases sharply to approximately -30 by layer 10, fluctuates between -30 and -40 until layer 30, and ends around -50.
* **Q-Anchored (HotpotQA):** (Dash-Dot Blue Line) Starts at 0, decreases sharply to approximately -30 by layer 10, fluctuates between -30 and -40 until layer 30, and ends around -50.
* **A-Anchored (HotpotQA):** (Solid Green Line) Starts at 0, decreases sharply to approximately -30 by layer 10, fluctuates between -30 and -40 until layer 30, and ends around -50.
* **Q-Anchored (NQ):** (Dotted-Dashed Pink Line) Starts at 0, decreases sharply to approximately -30 by layer 10, fluctuates between -30 and -40 until layer 30, and ends around -50.
* **A-Anchored (NQ):** (Dotted Black Line) Starts at 0, increases to approximately 10 by layer 10, and then remains relatively stable between 10 and 5 until layer 30.
### Key Observations
* The Q-Anchored approaches for PopQA, TriviaQA, HotpotQA, and NQ datasets generally show a decrease in performance (negative ΔP) as the layer number increases.
* The A-Anchored approach for PopQA shows a slight decrease in performance, while A-Anchored for NQ shows a slight increase in performance.
* The performance trends are similar between Mistral-7B-v0.1 and Mistral-7B-v0.3.
* There is a noticeable drop in performance for Q-Anchored approaches in the initial layers (0-10).
### Interpretation
The graphs suggest that the Q-Anchored approaches are more sensitive to the layer number, with performance decreasing as the model processes deeper layers. This could indicate that the question encoding becomes less relevant or effective in later layers. The A-Anchored approaches, on the other hand, show more stable performance across layers, suggesting that the answer encoding remains relevant throughout the model. The similarity in trends between v0.1 and v0.3 indicates that the performance characteristics are consistent across these versions of the Mistral-7B model. The initial drop in performance for Q-Anchored approaches may be due to the model initially focusing on question encoding but then shifting its attention to other aspects of the task in later layers.