\n
## Line Chart: Delta P (ΔP) vs. Layer for Mistral-7B Models
### Overview
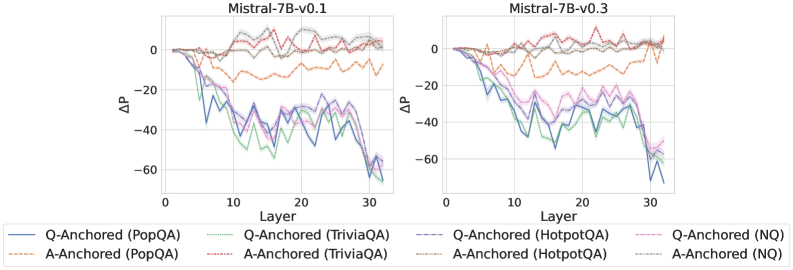
The image presents two line charts, side-by-side, displaying the change in probability (ΔP) as a function of layer number for two versions of the Mistral-7B language model: v0.1 and v0.3. Each chart shows multiple lines representing different question-answering datasets and anchoring methods. The x-axis represents the layer number, ranging from 0 to approximately 32. The y-axis represents ΔP, ranging from approximately -65 to 5.
### Components/Axes
* **X-axis:** Layer (ranging from 0 to 32, with gridlines at integer values).
* **Y-axis:** ΔP (Delta P, change in probability, ranging from approximately -65 to 5, with gridlines at intervals of 10).
* **Left Chart Title:** Mistral-7B-v0.1
* **Right Chart Title:** Mistral-7B-v0.3
* **Legend (Bottom-Center):** Contains labels for each line, indicating the anchoring method and dataset.
* Q-Anchored (PopQA) - Blue solid line
* A-Anchored (PopQA) - Orange dashed line
* Q-Anchored (TriviaQA) - Purple solid line
* A-Anchored (TriviaQA) - Brown dashed line
* Q-Anchored (HotpotQA) - Green dashed-dotted line
* A-Anchored (HotpotQA) - Light Green dotted line
* Q-Anchored (NQ) - Teal solid line
* A-Anchored (NQ) - Grey dashed line
### Detailed Analysis or Content Details
**Mistral-7B-v0.1 (Left Chart):**
* **Q-Anchored (PopQA):** Starts at approximately 2, decreases steadily to approximately -45 at layer 30.
* **A-Anchored (PopQA):** Starts at approximately 0, fluctuates around 0 until layer 20, then decreases to approximately -20 at layer 30.
* **Q-Anchored (TriviaQA):** Starts at approximately 0, decreases to approximately -40 at layer 20, then continues to decrease to approximately -60 at layer 30.
* **A-Anchored (TriviaQA):** Starts at approximately 0, fluctuates around 0 until layer 10, then decreases to approximately -30 at layer 30.
* **Q-Anchored (HotpotQA):** Starts at approximately 0, decreases to approximately -30 at layer 10, then decreases more rapidly to approximately -60 at layer 30.
* **A-Anchored (HotpotQA):** Starts at approximately 0, fluctuates around 0 until layer 15, then decreases to approximately -25 at layer 30.
* **Q-Anchored (NQ):** Starts at approximately 0, decreases to approximately -35 at layer 10, then decreases more rapidly to approximately -60 at layer 30.
* **A-Anchored (NQ):** Starts at approximately 0, fluctuates around 0 until layer 15, then decreases to approximately -20 at layer 30.
**Mistral-7B-v0.3 (Right Chart):**
* **Q-Anchored (PopQA):** Starts at approximately 2, decreases steadily to approximately -40 at layer 30.
* **A-Anchored (PopQA):** Starts at approximately 0, fluctuates around 0 until layer 20, then decreases to approximately -15 at layer 30.
* **Q-Anchored (TriviaQA):** Starts at approximately 0, decreases to approximately -35 at layer 20, then continues to decrease to approximately -55 at layer 30.
* **A-Anchored (TriviaQA):** Starts at approximately 0, fluctuates around 0 until layer 10, then decreases to approximately -25 at layer 30.
* **Q-Anchored (HotpotQA):** Starts at approximately 0, decreases to approximately -25 at layer 10, then decreases more rapidly to approximately -55 at layer 30.
* **A-Anchored (HotpotQA):** Starts at approximately 0, fluctuates around 0 until layer 15, then decreases to approximately -20 at layer 30.
* **Q-Anchored (NQ):** Starts at approximately 0, decreases to approximately -30 at layer 10, then decreases more rapidly to approximately -55 at layer 30.
* **A-Anchored (NQ):** Starts at approximately 0, fluctuates around 0 until layer 15, then decreases to approximately -15 at layer 30.
### Key Observations
* In both charts, the "Q-Anchored" lines generally exhibit a steeper decline in ΔP compared to the "A-Anchored" lines.
* The "HotpotQA" and "NQ" datasets consistently show the most significant decreases in ΔP, particularly for the "Q-Anchored" method.
* The v0.3 model generally shows less negative ΔP values across all datasets and anchoring methods compared to the v0.1 model, suggesting an improvement in performance.
* The "A-Anchored" lines tend to remain closer to 0 for a longer period before decreasing, indicating a more stable initial probability change.
### Interpretation
The charts illustrate how the change in probability (ΔP) varies across different layers of the Mistral-7B language model for different question-answering datasets and anchoring methods. The negative ΔP values suggest a decrease in the model's confidence or probability assignment as information propagates through the layers.
The steeper decline in ΔP for "Q-Anchored" lines suggests that anchoring based on the question itself leads to a more pronounced shift in probability distribution as the model processes the information. The datasets "HotpotQA" and "NQ" appear to be more challenging for the model, as they exhibit the largest decreases in ΔP.
The improvement observed in the v0.3 model, with less negative ΔP values, indicates that the model updates have likely enhanced its ability to maintain probability assignments across layers, potentially leading to more stable and accurate predictions. The "A-Anchored" lines' initial stability suggests that anchoring based on the answer might provide a more consistent starting point for probability calculations.
The differences between datasets highlight the varying difficulty levels and characteristics of each dataset, influencing how the model processes and assigns probabilities. This analysis provides insights into the model's internal workings and potential areas for improvement.