## Line Graph: ΔP vs. Layer in Mistral-7B Models (v0.1 and v0.3)
### Overview
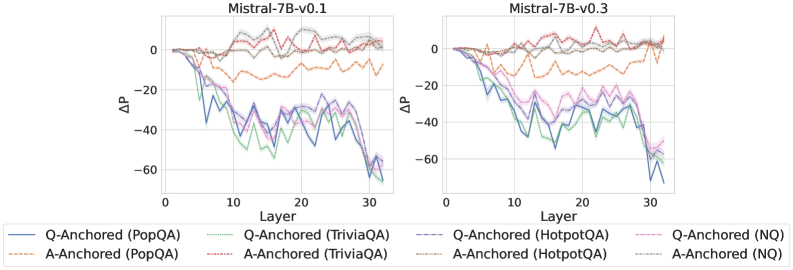
The image contains two side-by-side line graphs comparing the performance of Q-Anchored and A-Anchored methods across different datasets (PopQA, TriviaQA, HotpotQA, NQ) in Mistral-7B models (v0.1 and v0.3). The y-axis represents ΔP (change in performance), and the x-axis represents model layers (0–30). Each line corresponds to a specific anchoring method and dataset, with distinct colors and styles.
---
### Components/Axes
- **Y-Axis**: ΔP (Performance Change), ranging from -60 to 0.
- **X-Axis**: Layer (0–30), representing model depth.
- **Legends**:
- **Left Graph (v0.1)**:
- Solid blue: Q-Anchored (PopQA)
- Dashed orange: A-Anchored (PopQA)
- Solid green: Q-Anchored (TriviaQA)
- Dashed gray: A-Anchored (TriviaQA)
- Solid purple: Q-Anchored (HotpotQA)
- Dashed pink: A-Anchored (HotpotQA)
- Solid red: Q-Anchored (NQ)
- Dashed brown: A-Anchored (NQ)
- **Right Graph (v0.3)**:
- Same legend as v0.1 but applied to updated model version.
---
### Detailed Analysis
#### Mistral-7B-v0.1
1. **Q-Anchored (PopQA)** (solid blue):
- Starts at ΔP ≈ 0 (layer 0).
- Sharp decline to ΔP ≈ -50 (layer 10).
- Fluctuates between -30 and -50 until layer 30.
2. **A-Anchored (PopQA)** (dashed orange):
- Starts at ΔP ≈ 0.
- Gradual decline to ΔP ≈ -30 (layer 10).
- Stabilizes around -25–-30.
3. **Q-Anchored (TriviaQA)** (solid green):
- Sharp drop to ΔP ≈ -40 (layer 5).
- Oscillates between -20 and -40.
4. **A-Anchored (TriviaQA)** (dashed gray):
- Smoother decline to ΔP ≈ -25 (layer 10).
- Stabilizes around -20–-25.
5. **Q-Anchored (HotpotQA)** (solid purple):
- Moderate decline to ΔP ≈ -35 (layer 15).
- Fluctuates between -25 and -35.
6. **A-Anchored (HotpotQA)** (dashed pink):
- Gradual decline to ΔP ≈ -20 (layer 20).
- Stabilizes around -15–-20.
7. **Q-Anchored (NQ)** (solid red):
- Sharp drop to ΔP ≈ -55 (layer 10).
- Recovers to ΔP ≈ -40 (layer 30).
8. **A-Anchored (NQ)** (dashed brown):
- Steady decline to ΔP ≈ -30 (layer 20).
- Stabilizes around -25–-30.
#### Mistral-7B-v0.3
1. **Q-Anchored (PopQA)** (solid blue):
- Starts at ΔP ≈ 0.
- Gradual decline to ΔP ≈ -25 (layer 20).
- Stabilizes around -20–-25.
2. **A-Anchored (PopQA)** (dashed orange):
- Smooth decline to ΔP ≈ -20 (layer 20).
- Stabilizes around -15–-20.
3. **Q-Anchored (TriviaQA)** (solid green):
- Moderate decline to ΔP ≈ -30 (layer 15).
- Fluctuates between -20 and -30.
4. **A-Anchored (TriviaQA)** (dashed gray):
- Gradual decline to ΔP ≈ -22 (layer 25).
- Stabilizes around -18–-22.
5. **Q-Anchored (HotpotQA)** (solid purple):
- Slight decline to ΔP ≈ -15 (layer 10).
- Stabilizes around -10–-15.
6. **A-Anchored (HotpotQA)** (dashed pink):
- Minimal decline to ΔP ≈ -10 (layer 20).
- Stabilizes around -5–-10.
7. **Q-Anchored (NQ)** (solid red):
- Sharp drop to ΔP ≈ -45 (layer 10).
- Recovers to ΔP ≈ -30 (layer 30).
8. **A-Anchored (NQ)** (dashed brown):
- Steady decline to ΔP ≈ -25 (layer 25).
- Stabilizes around -20–-25.
---
### Key Observations
1. **General Trend**: Both models show a decline in ΔP across layers, but v0.3 exhibits smoother and more stable trends.
2. **Q-Anchored vs. A-Anchored**:
- Q-Anchored methods (solid lines) exhibit sharper initial declines and greater volatility, especially in v0.1.
- A-Anchored methods (dashed lines) show more gradual and stable performance.
3. **Dataset Impact**:
- **PopQA/TriviaQA**: Higher volatility in Q-Anchored methods.
- **HotpotQA/NQ**: Smoother trends, with NQ showing the most extreme initial drops.
4. **Version Comparison**:
- v0.3 demonstrates improved stability across all methods, with reduced fluctuations compared to v0.1.
---
### Interpretation
The data suggests that anchoring methods significantly influence model performance stability. Q-Anchored methods are more sensitive to layer changes, leading to larger ΔP variations, while A-Anchored methods maintain steadier performance. The datasets' complexity correlates with volatility: simpler datasets (e.g., PopQA) show sharper declines, while complex ones (e.g., HotpotQA) exhibit smoother trends. The transition from v0.1 to v0.3 indicates architectural improvements, reducing performance instability. Notably, Q-Anchored (NQ) in v0.1 experiences the most drastic drop (-55), suggesting potential overfitting or dataset-specific challenges. These findings highlight the importance of anchoring strategy selection based on dataset characteristics and model version.