## Line Chart: Model Performance Comparison
### Overview
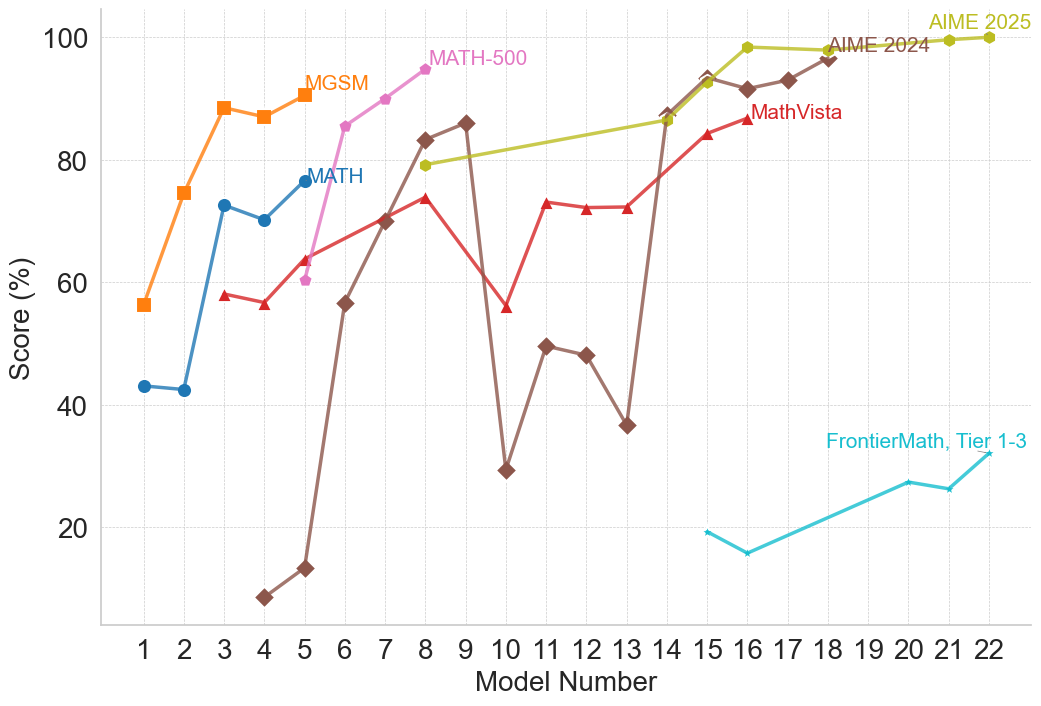
The image is a line chart comparing the performance of several models (MATH-500, MGSM, MATH, MathVista, AIME 2024, AIME 2025, and FrontierMath Tier 1-3) across a range of model numbers (1 to 22). The y-axis represents the score in percentage, ranging from 0 to 100. Each model's performance is plotted as a line, with different colors and markers distinguishing them.
### Components/Axes
* **X-axis:** Model Number, ranging from 1 to 22 in integer increments.
* **Y-axis:** Score (%), ranging from 0 to 100 in increments of 20.
* **Legend (Top):**
* MATH-500 (Pink Line, Circle Marker)
* MGSM (Orange Line, Square Marker)
* MATH (Blue Line, Circle Marker)
* MathVista (Red Line, Triangle Marker)
* AIME 2024 (Yellow-Green Line, Circle Marker)
* AIME 2025 (Green Line, Circle Marker)
* FrontierMath, Tier 1-3 (Teal Line, Circle Marker)
* Unlabeled (Brown Line, Diamond Marker)
### Detailed Analysis
* **MATH-500 (Pink Line, Circle Marker):**
* Model 4: ~60%
* Model 5: ~70%
* Model 6: ~75%
* Model 7: ~80%
* Model 8: ~83%
* Model 9: ~86%
* Model 10: ~90%
Trend: Generally increasing from Model 4 to Model 10.
* **MGSM (Orange Line, Square Marker):**
* Model 1: ~56%
* Model 2: ~75%
* Model 3: ~88%
* Model 4: ~90%
* Model 5: ~92%
* Model 6: ~88%
Trend: Rapidly increases from Model 1 to Model 4, then plateaus and decreases slightly.
* **MATH (Blue Line, Circle Marker):**
* Model 1: ~43%
* Model 2: ~43%
* Model 3: ~73%
* Model 4: ~68%
* Model 5: ~77%
Trend: Relatively flat from Model 1 to Model 2, then increases to Model 3, then decreases slightly.
* **MathVista (Red Line, Triangle Marker):**
* Model 3: ~58%
* Model 4: ~57%
* Model 5: ~62%
* Model 6: ~68%
* Model 7: ~70%
* Model 8: ~74%
* Model 9: ~80%
* Model 10: ~55%
* Model 11: ~73%
* Model 12: ~73%
* Model 13: ~72%
* Model 14: ~85%
* Model 15: ~85%
Trend: Generally increasing, with some fluctuations, up to Model 15.
* **AIME 2024 (Yellow-Green Line, Circle Marker):**
* Model 7: ~83%
* Model 8: ~84%
* Model 9: ~85%
* Model 15: ~90%
* Model 16: ~92%
* Model 17: ~98%
* Model 18: ~98%
* Model 19: ~98%
* Model 20: ~98%
* Model 21: ~99%
* Model 22: ~100%
Trend: Steadily increasing, reaching near-perfect scores from Model 17 onwards.
* **AIME 2025 (Green Line, Circle Marker):**
* Model 17: ~95%
* Model 18: ~97%
* Model 19: ~98%
* Model 20: ~98%
* Model 21: ~99%
* Model 22: ~100%
Trend: High and relatively stable, approaching perfect scores.
* **FrontierMath, Tier 1-3 (Teal Line, Circle Marker):**
* Model 15: ~19%
* Model 16: ~16%
* Model 19: ~24%
* Model 20: ~27%
* Model 21: ~27%
* Model 22: ~28%
Trend: Low and relatively flat, with a slight upward trend.
* **Unlabeled (Brown Line, Diamond Marker):**
* Model 5: ~9%
* Model 6: ~14%
* Model 7: ~57%
* Model 8: ~78%
* Model 9: ~84%
* Model 10: ~86%
* Model 11: ~30%
* Model 12: ~50%
* Model 13: ~48%
* Model 14: ~37%
* Model 15: ~19%
Trend: Highly volatile, with a sharp increase followed by a sharp decrease.
### Key Observations
* AIME 2025 and AIME 2024 consistently achieve the highest scores, especially for higher model numbers.
* FrontierMath, Tier 1-3, consistently scores the lowest across all model numbers.
* The unlabeled model (brown line) exhibits the most significant fluctuations in performance.
* MGSM performs well initially but plateaus and decreases slightly.
### Interpretation
The chart provides a comparative analysis of different models' performance on a specific task, as indicated by the "Score (%)". The AIME models (2024 and 2025) demonstrate superior performance, suggesting they are the most effective for this task. FrontierMath, Tier 1-3, consistently underperforms, indicating it may not be suitable for the same task or requires further optimization. The volatile performance of the unlabeled model suggests instability or sensitivity to specific model numbers. The other models (MATH-500, MGSM, MATH, MathVista) show varying degrees of effectiveness, with MGSM performing well initially but not sustaining its high performance. The data suggests that the choice of model significantly impacts the outcome, and careful consideration should be given to the specific requirements of the task when selecting a model.