TECHNICAL ASSET FINGERPRINT
51a01a22d1bc0fa377892fa8
Click to view fullscreen
Press ESC or click to close
FOUND IN PAPERS
EXPERT: gemini-3.1-pro-preview VERSION 1
RUNTIME: gemini/gemini-3.1-pro-preview
INTEL_VERIFIED
## Line Chart: AI Model Performance on Mathematical Benchmarks
### Overview
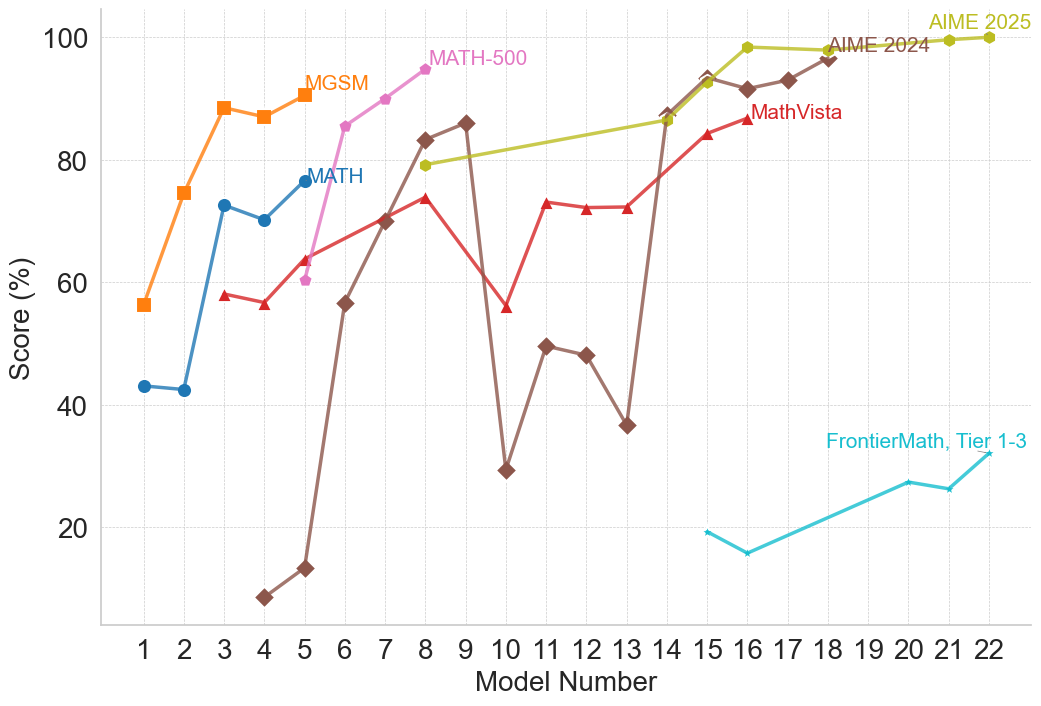
This image is a line chart illustrating the performance scores (in percentages) of various sequentially numbered models across seven different mathematical evaluation benchmarks. The chart demonstrates a general trend of increasing performance as the model number increases, with older benchmarks reaching near-perfect scores while newer benchmarks remain highly challenging.
### Components/Axes
* **Y-Axis (Left):** Labeled "Score (%)". The scale ranges from 20 to 100, with major tick marks and horizontal dashed grid lines at 20, 40, 60, 80, and 100.
* **X-Axis (Bottom):** Labeled "Model Number". The scale ranges from 1 to 22, with major tick marks and vertical dashed grid lines at every integer from 1 to 22.
* **Legend:** There is no standalone legend box. Instead, data series are identified by text labels placed directly adjacent to their respective lines, matching the color of the line.
### Detailed Analysis
The chart contains seven distinct data series. Below is the trend verification and extracted approximate data points for each, grounded by their visual characteristics.
**1. MGSM**
* **Visuals:** Orange line, square markers. Label "MGSM" is located near the top-left, above the line at Model 5.
* **Trend:** The line starts at a mid-range score, rises sharply by Model 3, dips slightly at Model 4, and peaks at Model 5, showing early mastery by lower-numbered models.
* **Data Points (Approximate):**
* Model 1: 56%
* Model 2: 75%
* Model 3: 88%
* Model 4: 87%
* Model 5: 91%
**2. MATH**
* **Visuals:** Blue line, circular markers. Label "MATH" is located near the top-left, to the right of the final data point at Model 5.
* **Trend:** Starts lower than MGSM, remains flat between Models 1 and 2, jumps significantly at Model 3, dips slightly, and rises again at Model 5.
* **Data Points (Approximate):**
* Model 1: 43%
* Model 2: 42%
* Model 3: 73%
* Model 4: 70%
* Model 5: 77%
**3. MATH-500**
* **Visuals:** Pink/Light Purple line, small circular/dot markers. Label "MATH-500" is located near the top-center, to the right of the final data point at Model 8.
* **Trend:** This series begins where the "MATH" series ends (Model 5) but at a lower score. It shows a steep, uninterrupted linear progression upward, terminating near 100%.
* **Data Points (Approximate):**
* Model 5: 60%
* Model 6: 85%
* Model 7: 90%
* Model 8: 95%
**4. MathVista**
* **Visuals:** Red line, upward-pointing triangle markers. Label "MathVista" is located in the upper-right quadrant, below the line at Model 16.
* **Trend:** Starts at Model 3, rises gradually, experiences a sharp drop at Model 10, recovers immediately by Model 11, plateaus briefly, and then continues to rise toward 90%.
* **Data Points (Approximate):**
* Model 3: 58%
* Model 4: 56%
* Model 5: 64%
* Model 8: 74%
* Model 10: 56%
* Model 11: 73%
* Model 12: 72%
* Model 13: 72%
* Model 15: 84%
* Model 16: 87%
**5. AIME 2024**
* **Visuals:** Brown line, diamond markers. Label "AIME 2024" is located in the top-right, adjacent to the data point at Model 18.
* **Trend:** This is the most volatile series. It starts extremely low at Model 4, rises rapidly to Model 9, suffers a massive drop at Model 10, recovers partially, drops again at Model 13, and then skyrockets to near 100% by Model 15, where it stabilizes.
* **Data Points (Approximate):**
* Model 4: 8%
* Model 5: 13%
* Model 6: 56%
* Model 7: 70%
* Model 8: 83%
* Model 9: 86%
* Model 10: 29%
* Model 11: 49%
* Model 12: 48%
* Model 13: 37%
* Model 14: 87%
* Model 15: 93%
* Model 16: 91%
* Model 17: 93%
* Model 18: 97%
**6. AIME 2025**
* **Visuals:** Olive Green/Yellow-Green line, circular markers. Label "AIME 2025" is located at the extreme top-right, above the final data points.
* **Trend:** Starts relatively high at Model 8, rises steadily with a slight plateau between Models 16 and 18, and finishes at a perfect or near-perfect score by Model 22.
* **Data Points (Approximate):**
* Model 8: 79%
* Model 14: 86%
* Model 15: 92%
* Model 16: 98%
* Model 18: 98%
* Model 21: 99%
* Model 22: 100%
**7. FrontierMath, Tier 1-3**
* **Visuals:** Cyan/Light Blue line, star markers. Label "FrontierMath, Tier 1-3" is located in the bottom-right quadrant, above the line at Model 18.
* **Trend:** This series appears only for the latest models (15-22). It starts very low, dips slightly, and then exhibits a slow, steady climb, but remains significantly lower than all other benchmarks.
* **Data Points (Approximate):**
* Model 15: 19%
* Model 16: 16%
* Model 20: 27%
* Model 21: 26%
* Model 22: 32%
### Key Observations
* **Benchmark Saturation:** Older or easier benchmarks (MGSM, MATH, MATH-500) are effectively "solved" (reaching 90%+) by earlier models (Models 5-8).
* **Volatility in Mid-Models:** Models 10 and 13 show significant performance regressions specifically on the AIME 2024 and MathVista benchmarks, breaking the otherwise upward trend.
* **The Frontier:** The "FrontierMath, Tier 1-3" benchmark is the only evaluation where the most advanced models (Models 20-22) fail to achieve high scores, maxing out at approximately 32%.
### Interpretation
This chart visually narrates the rapid progression of AI capabilities in mathematics and the corresponding need for increasingly difficult evaluation metrics. The X-axis ("Model Number") acts as a proxy for chronological advancement or increasing model scale/capability.
As models progress from 1 to 22, they systematically conquer benchmarks. Once a benchmark like MGSM or MATH approaches the 100% ceiling, it loses its utility for differentiating advanced models, necessitating the introduction of harder tests like AIME 2024/2025.
The severe dips at Models 10 and 13 for AIME 2024 and MathVista are notable anomalies. Reading between the lines, these "Model Numbers" likely do not represent a strict, single-lineage chronological release (e.g., GPT-1 to GPT-4). Instead, they likely represent a mix of different model families, sizes, or architectures plotted on a general timeline of release. Models 10 and 13 might be smaller, more efficient models, or models not specifically trained on the reasoning required for AIME or the visual components required for MathVista, resulting in lower scores compared to their immediate predecessors.
Finally, the introduction of "FrontierMath, Tier 1-3" highlights the current edge of AI research. While Models 20-22 can perfectly solve AIME 2025, they struggle immensely with FrontierMath, indicating that this specific benchmark is currently the primary metric for measuring future mathematical reasoning advancements in AI.
DECODING INTELLIGENCE...