## Line Chart: Model Performance on Math Benchmarks
### Overview
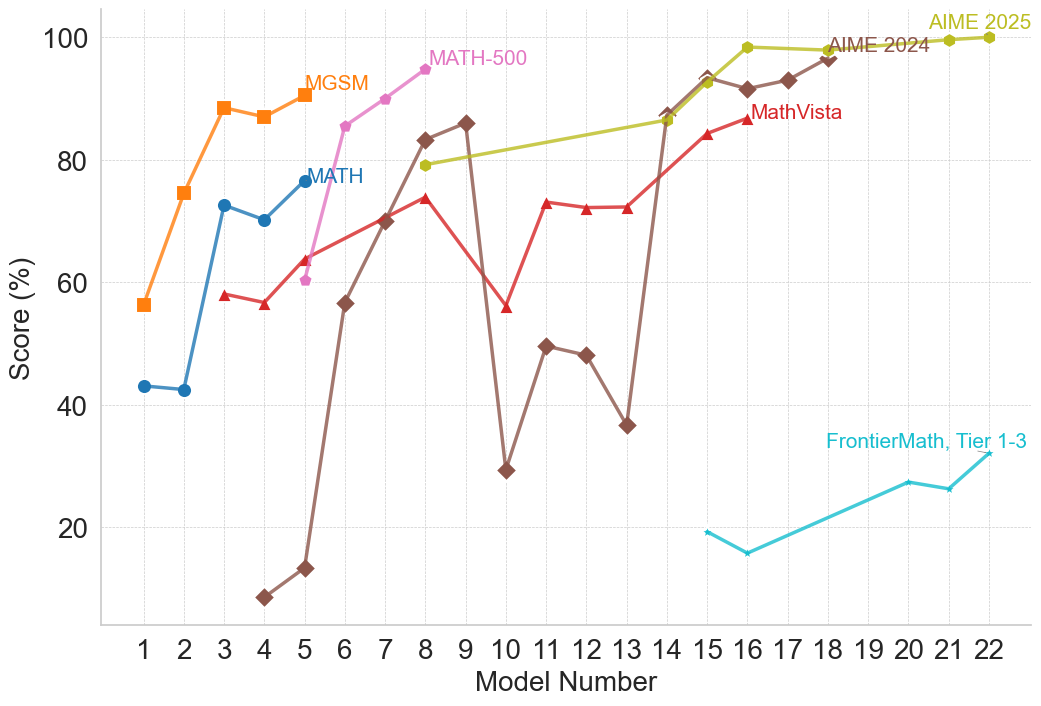
This line chart displays the performance of different models (numbered 1 to 22) on several math benchmark datasets. The y-axis represents the score in percentage, while the x-axis represents the model number. Six different datasets are represented by distinct colored lines: MGSM, MATH, MATH-500, AIME 2024, AIME 2025, and MathVista, and FrontierMath Tier 1-3.
### Components/Axes
* **X-axis:** "Model Number" ranging from 1 to 22.
* **Y-axis:** "Score (%)" ranging from 0 to 100.
* **Data Series:**
* MGSM (Orange)
* MATH (Blue)
* MATH-500 (Teal)
* AIME 2024 (Gray)
* AIME 2025 (Yellow)
* MathVista (Purple)
* FrontierMath Tier 1-3 (Brown)
* **Legend:** Located in the top-right corner, associating colors with dataset names.
### Detailed Analysis
Here's a breakdown of each data series, noting trends and approximate values:
* **MGSM (Orange):** Starts at approximately 58% at Model 1, rises sharply to a peak of around 92% at Model 4, then fluctuates between 85% and 92% until Model 18, and then drops to around 80% at Model 22.
* **MATH (Blue):** Begins at approximately 42% at Model 1, increases steadily to around 78% at Model 6, plateaus around 80-85% from Models 7 to 16, and then rises to approximately 90% at Model 18, remaining stable until Model 22.
* **MATH-500 (Teal):** Starts at approximately 60% at Model 1, increases to around 82% at Model 8, then declines to around 70% at Model 12, and then rises again to around 88% at Model 16, remaining relatively stable until Model 22.
* **AIME 2024 (Gray):** Starts at approximately 55% at Model 1, increases to around 72% at Model 7, then fluctuates between 70% and 85% until Model 16, and then rises to approximately 94% at Model 18, remaining stable until Model 22.
* **AIME 2025 (Yellow):** Starts at approximately 65% at Model 1, increases steadily to around 98% at Model 18, and remains stable at approximately 98-100% until Model 22.
* **MathVista (Purple):** Starts at approximately 80% at Model 1, increases to around 88% at Model 16, and remains stable until Model 22.
* **FrontierMath Tier 1-3 (Brown):** Starts at approximately 15% at Model 1, increases to around 30% at Model 7, then declines to around 25% at Model 12, and then rises again to around 35% at Model 18, remaining relatively stable until Model 22.
### Key Observations
* AIME 2025 consistently achieves the highest scores, often reaching near 100% by Model 18.
* FrontierMath Tier 1-3 consistently has the lowest scores, remaining below 40% throughout the entire range of models.
* MGSM shows a rapid initial improvement, but its performance plateaus and fluctuates.
* MATH and AIME 2024 exhibit a more gradual and sustained improvement.
* MATH-500 shows a more volatile performance, with peaks and dips.
* MathVista starts with a high score and maintains it throughout.
### Interpretation
The chart demonstrates the performance of various models on different math benchmark datasets as the model number increases, presumably representing model complexity or training iterations. The significant difference in scores between AIME 2025 and FrontierMath Tier 1-3 suggests a substantial gap in difficulty between these datasets. The consistent high performance of AIME 2025 indicates that the models are well-suited for this particular benchmark. The fluctuating performance of MGSM and MATH-500 could be due to the specific characteristics of these datasets, potentially involving more complex or nuanced problem-solving skills. The overall trend suggests that increasing the model number generally leads to improved performance, but the rate of improvement varies depending on the dataset. The data suggests that the models are becoming more proficient at solving math problems, but there is still considerable room for improvement, particularly on more challenging benchmarks like FrontierMath Tier 1-3. The consistent high starting score of MathVista suggests it may be a simpler benchmark or that the models are pre-trained on similar data.