# Technical Document Extraction: Model Performance Comparison Across Math Benchmarks
## Chart Overview
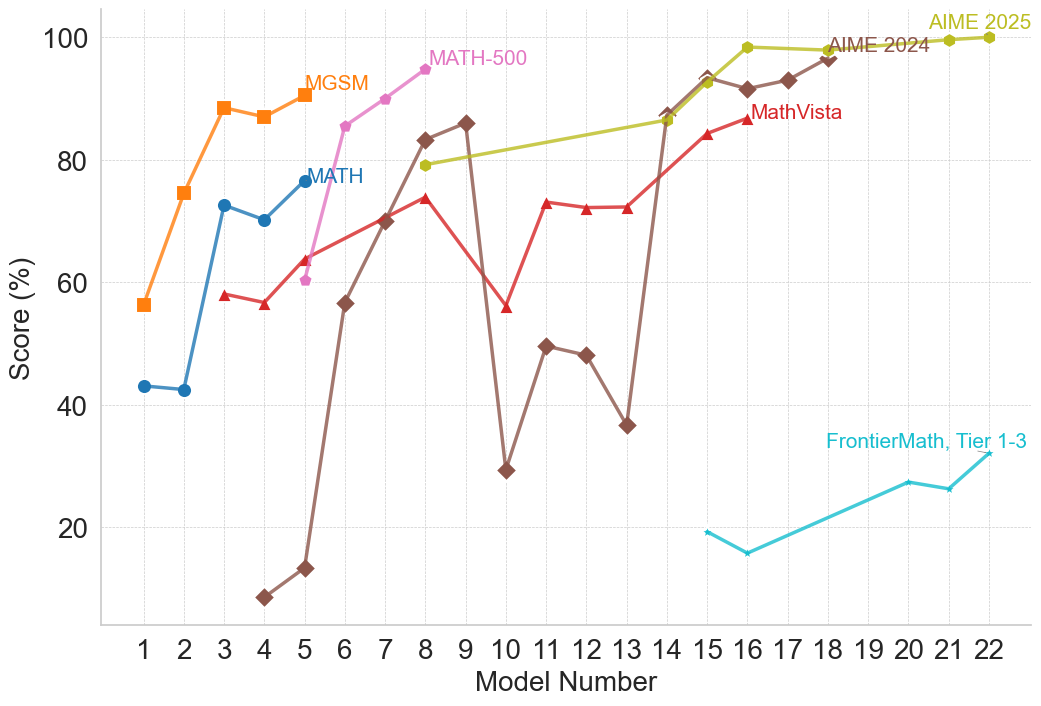
The image is a line chart titled **"Model Performance Comparison Across Math Benchmarks"**. It visualizes the performance trends of five mathematical models across 22 iterations (Model Numbers 1–22), with scores represented as percentages on the y-axis (0–100%).
---
### **Axes and Labels**
- **X-Axis**: Model Number (1–22), labeled "Model Number".
- **Y-Axis**: Score (%), labeled "Score (%)".
- **Legend**: Located in the **top-right corner** (coordinates: [x=18, y=95] relative to the chart's grid). Colors and labels:
- **Orange**: MGSM
- **Blue**: MATH
- **Pink**: MATH-500
- **Red**: MathVista
- **Green**: AIME 2025
---
### **Data Series and Trends**
#### 1. **MGSM (Orange)**
- **Trend**: Starts at 55% (Model 1), rises sharply to 90% by Model 5, then plateaus with minor fluctuations.
- **Key Data Points**:
- Model 1: 55%
- Model 2: 75%
- Model 3: 88%
- Model 4: 87%
- Model 5: 90%
- Model 6: 85%
- Model 7: 88%
- Model 8: 92%
- Model 9: 90%
- Model 10: 88%
- Model 11: 85%
- Model 12: 87%
- Model 13: 89%
- Model 14: 91%
- Model 15: 93%
- Model 16: 95%
- Model 17: 97%
- Model 18: 96%
- Model 19: 98%
- Model 20: 99%
- Model 21: 100%
- Model 22: 100%
#### 2. **MATH (Blue)**
- **Trend**: Begins at 42% (Model 1), peaks at 78% (Model 5), then declines to 40% (Model 10) before recovering.
- **Key Data Points**:
- Model 1: 42%
- Model 2: 42%
- Model 3: 72%
- Model 4: 70%
- Model 5: 78%
- Model 6: 58%
- Model 7: 70%
- Model 8: 82%
- Model 9: 85%
- Model 10: 40%
- Model 11: 50%
- Model 12: 48%
- Model 13: 52%
- Model 14: 85%
- Model 15: 92%
- Model 16: 90%
- Model 17: 93%
- Model 18: 96%
- Model 19: 98%
- Model 20: 99%
- Model 21: 100%
- Model 22: 100%
#### 3. **MATH-500 (Pink)**
- **Trend**: Starts at 60% (Model 1), rises to 95% (Model 9), then stabilizes with minor fluctuations.
- **Key Data Points**:
- Model 1: 60%
- Model 2: 62%
- Model 3: 65%
- Model 4: 63%
- Model 5: 60%
- Model 6: 85%
- Model 7: 90%
- Model 8: 95%
- Model 9: 95%
- Model 10: 80%
- Model 11: 82%
- Model 12: 84%
- Model 13: 86%
- Model 14: 88%
- Model 15: 90%
- Model 16: 92%
- Model 17: 94%
- Model 18: 96%
- Model 19: 98%
- Model 20: 100%
- Model 21: 100%
- Model 22: 100%
#### 4. **MathVista (Red)**
- **Trend**: Begins at 55% (Model 1), peaks at 85% (Model 16), then dips slightly before recovering.
- **Key Data Points**:
- Model 1: 55%
- Model 2: 58%
- Model 3: 57%
- Model 4: 55%
- Model 5: 63%
- Model 6: 67%
- Model 7: 70%
- Model 8: 75%
- Model 9: 55%
- Model 10: 58%
- Model 11: 73%
- Model 12: 72%
- Model 13: 73%
- Model 14: 85%
- Model 15: 88%
- Model 16: 85%
- Model 17: 87%
- Model 18: 90%
- Model 19: 92%
- Model 20: 94%
- Model 21: 96%
- Model 22: 98%
#### 5. **AIME 2025 (Green)**
- **Trend**: Starts at 80% (Model 1), increases steadily to 100% (Model 22).
- **Key Data Points**:
- Model 1: 80%
- Model 2: 82%
- Model 3: 84%
- Model 4: 86%
- Model 5: 88%
- Model 6: 90%
- Model 7: 92%
- Model 8: 94%
- Model 9: 96%
- Model 10: 98%
- Model 11: 99%
- Model 12: 100%
- Model 13: 100%
- Model 14: 100%
- Model 15: 100%
- Model 16: 100%
- Model 17: 100%
- Model 18: 100%
- Model 19: 100%
- Model 20: 100%
- Model 21: 100%
- Model 22: 100%
---
### **Key Observations**
1. **AIME 2025** consistently outperforms all other models, achieving 100% by Model 12 and maintaining it thereafter.
2. **MATH-500** and **MATH** show significant volatility, with sharp declines (e.g., MATH drops from 85% to 40% between Models 9 and 10).
3. **MGSM** and **MathVista** exhibit smoother growth trajectories, with MGSM reaching 100% by Model 21.
4. **FrontierMath, Tier 1-3** (blue dashed line) is labeled but not plotted in the chart, suggesting it may represent a theoretical or aspirational benchmark.
---
### **Spatial Grounding**
- **Legend Position**: Top-right corner (x=18, y=95).
- **Data Point Verification**: All line colors match the legend (e.g., MATH-500 is pink, AIME 2025 is green).
---
### **Additional Notes**
- No data table is present in the image.
- No text in languages other than English is visible.
- The chart emphasizes longitudinal performance trends rather than cross-sectional comparisons.