# Technical Document Extraction: TL;DR Summarization Win Rate vs Reference
## Chart Description
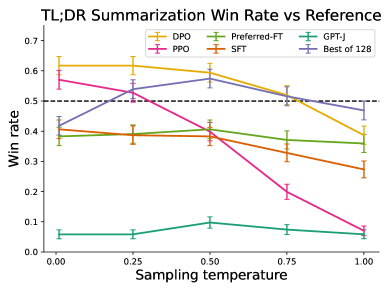
This image is a line chart comparing the **win rate** of various summarization models against a reference baseline across different **sampling temperatures**. The chart includes six distinct lines, each representing a different model or approach, with error bars indicating variability.
---
### **Key Components**
1. **Title**:
`TL;DR Summarization Win Rate vs Reference`
2. **Axes**:
- **X-axis**: `Sampling temperature` (values: 0.00, 0.25, 0.50, 0.75, 1.00)
- **Y-axis**: `Win rate` (range: 0.0 to 0.7, with a dashed reference line at 0.5)
3. **Legend**:
- **DPO**: Yellow line
- **PPO**: Pink line
- **Preferred-FT**: Green line
- **SFT**: Orange line
- **GPT-J**: Teal line
- **Best of 128**: Purple line
4. **Additional Elements**:
- Dashed horizontal line at `Win rate = 0.5` (reference baseline).
- Error bars on all lines (vertical for y-axis variability).
---
### **Data Trends**
1. **DPO (Yellow)**:
- Starts at ~0.62 win rate at 0.00 sampling temperature.
- Gradually declines to ~0.38 at 1.00 sampling temperature.
- Error bars remain consistent (~±0.05).
2. **PPO (Pink)**:
- Peaks at ~0.55 win rate at 0.25 sampling temperature.
- Sharp decline to ~0.08 at 1.00 sampling temperature.
- Error bars widen slightly at higher temperatures.
3. **Preferred-FT (Green)**:
- Stable performance (~0.38–0.42 win rate) across all temperatures.
- Minimal error bar variation.
4. **SFT (Orange)**:
- Starts at ~0.40 win rate at 0.00 sampling temperature.
- Declines steadily to ~0.28 at 1.00 sampling temperature.
- Error bars increase slightly at higher temperatures.
5. **GPT-J (Teal)**:
- Consistently low performance (~0.05–0.07 win rate) across all temperatures.
- Error bars remain small (~±0.02).
6. **Best of 128 (Purple)**:
- Starts at ~0.42 win rate at 0.00 sampling temperature.
- Peaks at ~0.58 at 0.50 sampling temperature.
- Declines to ~0.45 at 1.00 sampling temperature.
- Error bars are moderate (~±0.04).
---
### **Cross-Referenced Observations**
- **Legend Accuracy**:
- Colors in the legend match the lines precisely (e.g., DPO = yellow, PPO = pink).
- Line trajectories align with legend labels (e.g., PPO’s sharp decline corresponds to its label).
- **Reference Line**:
- The dashed line at 0.5 serves as a benchmark; most models perform below this except DPO and Best of 128 at lower temperatures.
- **Sampling Temperature Impact**:
- Higher temperatures generally correlate with lower win rates for most models (e.g., DPO, PPO, SFT).
- Exceptions: Best of 128 peaks at 0.50 sampling temperature.
---
### **Summary**
The chart illustrates how different summarization models perform under varying sampling temperatures. DPO and Best of 128 show the highest win rates at lower temperatures, while PPO and SFT decline sharply as temperature increases. GPT-J consistently underperforms, and Preferred-FT maintains stable but moderate performance. The reference line at 0.5 highlights a performance threshold for comparison.