## Line Chart: HellaSwag Score vs. Model Number
### Overview
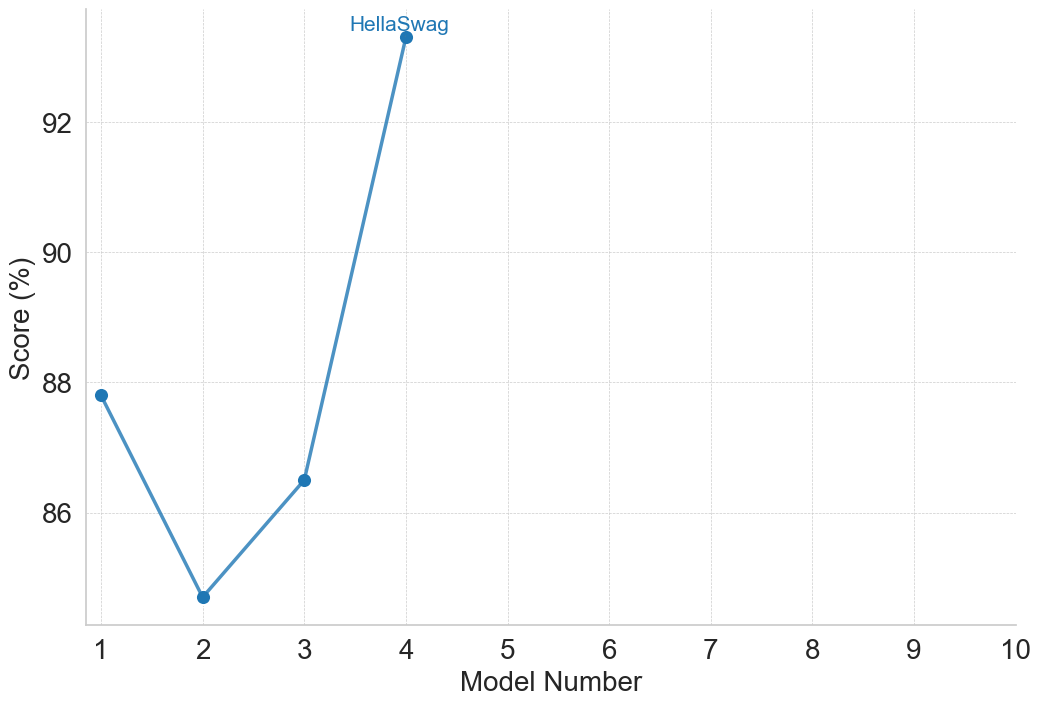
This image is a 2D line chart displaying the performance scores of a sequence of models on a specific metric or benchmark labeled "HellaSwag". The chart plots a single data series across four distinct model iterations, showing an initial dip in performance followed by a significant increase.
### Components/Axes
**Component Isolation & Spatial Grounding:**
* **Y-Axis (Left):**
* **Label:** "Score (%)" (Rotated 90 degrees counter-clockwise, centered vertically along the axis).
* **Scale:** Linear, continuous numerical scale.
* **Markers:** Explicitly labeled at 86, 88, 90, and 92.
* **Gridlines:** Horizontal dashed gridlines extend from the y-axis across the chart area at intervals of 2 units. There is an implied gridline at the top (~94) and the bottom x-axis line acts as a baseline (approximately ~84.2 based on visual spacing).
* **X-Axis (Bottom):**
* **Label:** "Model Number" (Centered horizontally below the axis).
* **Scale:** Linear, discrete integer scale.
* **Markers:** Explicitly labeled from 1 to 10 (1, 2, 3, 4, 5, 6, 7, 8, 9, 10).
* **Gridlines:** Vertical dashed gridlines extend upward from each integer marker.
* **Main Chart Area (Center):** Contains a single data series represented by a solid blue line connecting solid blue circular data points.
* **Legend/Labels:** There is no separate legend box. Instead, the text "HellaSwag" is written in blue, positioned directly above the final data point at x=4, acting as a direct label for the data series.
### Detailed Analysis
**Trend Verification:**
The single blue line ("HellaSwag") begins at Model 1. It slopes downward sharply to Model 2. From Model 2, it slopes upward moderately to Model 3. From Model 3, it slopes upward very sharply, reaching its peak at Model 4. The line terminates at Model 4; there is no data plotted for Models 5 through 10.
**Data Point Extraction (Approximate values with ±0.2% uncertainty):**
* **Model 1 (x=1):** The point is located just below the 88% gridline.
* *Estimated Value:* ~87.8%
* **Model 2 (x=2):** The point drops significantly, located slightly above the bottom axis line (which is visually estimated around 84.2%).
* *Estimated Value:* ~84.7%
* **Model 3 (x=3):** The point rises, located roughly a quarter of the way between the 86% and 88% gridlines.
* *Estimated Value:* ~86.5%
* **Model 4 (x=4):** The point spikes dramatically, located more than halfway between the 92% gridline and the implied 94% top boundary.
* *Estimated Value:* ~93.3%
### Key Observations
1. **Incomplete Data Series:** While the x-axis anticipates 10 models, data is only provided for the first four.
2. **Performance Dip:** Model 2 represents a significant regression in performance compared to Model 1 (a drop of roughly 3%).
3. **Performance Spike:** Model 4 represents a massive leap in performance, jumping approximately 6.8% from Model 3 and easily surpassing the initial baseline set by Model 1.
### Interpretation
This chart tracks the iterative development of a machine learning model (or a series of related models) evaluated against the "HellaSwag" benchmark, which is a well-known dataset for evaluating commonsense natural language inference in large language models (LLMs).
The data suggests a non-linear development process. The drop at Model 2 implies an architectural change, training data alteration, or hyperparameter tuning that negatively impacted this specific benchmark. However, the subsequent models show rapid recovery and enhancement. The massive jump between Model 3 and Model 4 suggests a "breakthrough" iteration—perhaps a significant scaling up of parameters, a highly successful change in training methodology, or the introduction of a new architectural paradigm that drastically improved commonsense reasoning capabilities.
The presence of x-axis markers up to 10, despite data stopping at 4, strongly implies this is a "work in progress" chart. It was likely generated during an ongoing project where 10 models are planned, but only the first four have completed training and evaluation on the HellaSwag benchmark at the time the chart was rendered.