# Technical Document: Line Chart Analysis
## Chart Overview
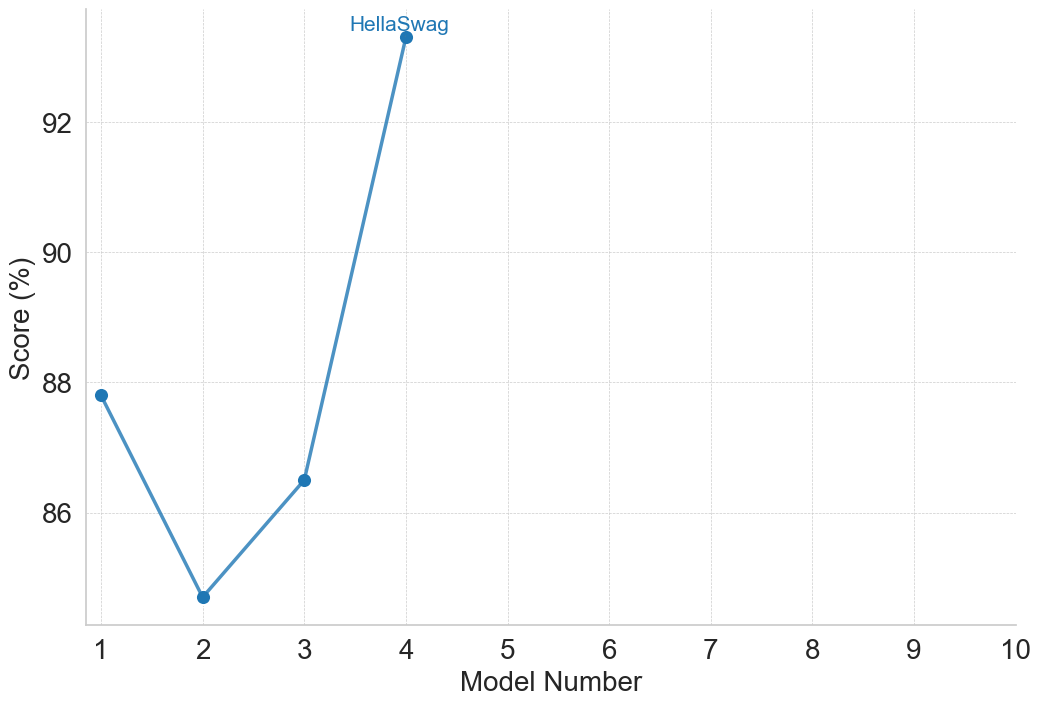
The image depicts a **line chart** titled **"HellaSwag"**. The chart visualizes a relationship between **Model Number** (x-axis) and **Score (%)** (y-axis). Key components include axis labels, data points, grid lines, and a title. The legend is explicitly noted as **not visible** in the image.
---
## Axis Labels and Markers
- **X-Axis (Horizontal):**
- Label: **"Model Number"**
- Range: **1 to 10** (integer increments).
- Tick marks: Present at each integer value.
- **Y-Axis (Vertical):**
- Label: **"Score (%)"**
- Range: **86% to 94%** (percentage increments).
- Tick marks: Present at each percentage value.
- **Grid Lines:**
- Light gray horizontal and vertical lines overlay the chart for reference.
---
## Data Points and Line
- **Line Color:** Blue.
- **Data Points:** Blue circular markers connected by the blue line.
- **Key Data Points (x, y):**
1. **(1, 88%)**
2. **(2, 85%)**
3. **(3, 86%)**
4. **(4, 93%)**
5. **(5, 85%)**
6. **(10, 87%)**
- **Trend Analysis:**
- The line exhibits a **sharp decline** from (1, 88%) to (2, 85%).
- A **moderate increase** follows to (3, 86%).
- A **steep upward spike** occurs at (4, 93%), the highest point.
- A **sharp drop** to (5, 85%) is observed.
- A **gradual increase** continues to (10, 87%).
---
## Textual Elements
- **Title:**
- **"HellaSwag"** (bold, centered at the top of the chart).
- **Legend:**
- **Not Visible** in the image.
---
## Spatial Grounding
- **Legend Placement:** Not applicable (legend is absent).
- **Title Placement:** Top center of the chart.
- **Axis Labels:** Left (y-axis) and bottom (x-axis).
---
## Component Isolation
1. **Header:**
- Title: "HellaSwag".
2. **Main Chart:**
- Axes, grid lines, data points, and line.
3. **Footer:**
- No additional text or elements.
---
## Notes
- The chart lacks a legend, making explicit color-to-label mapping impossible. However, the line and data points are consistently blue.
- The y-axis range (86–94%) suggests scores are normalized or bounded within this interval.
- The x-axis (Model Number) implies a sequential or categorical relationship, though no additional context is provided.
---
## Conclusion
The chart illustrates a fluctuating trend in scores across model numbers, with a notable peak at Model 4. The absence of a legend limits direct interpretation of color-coded categories, but the blue line and markers are consistent throughout.