## Bar Chart: SRCC (MI) Performance Across Phases and System/Utterance Levels
### Overview
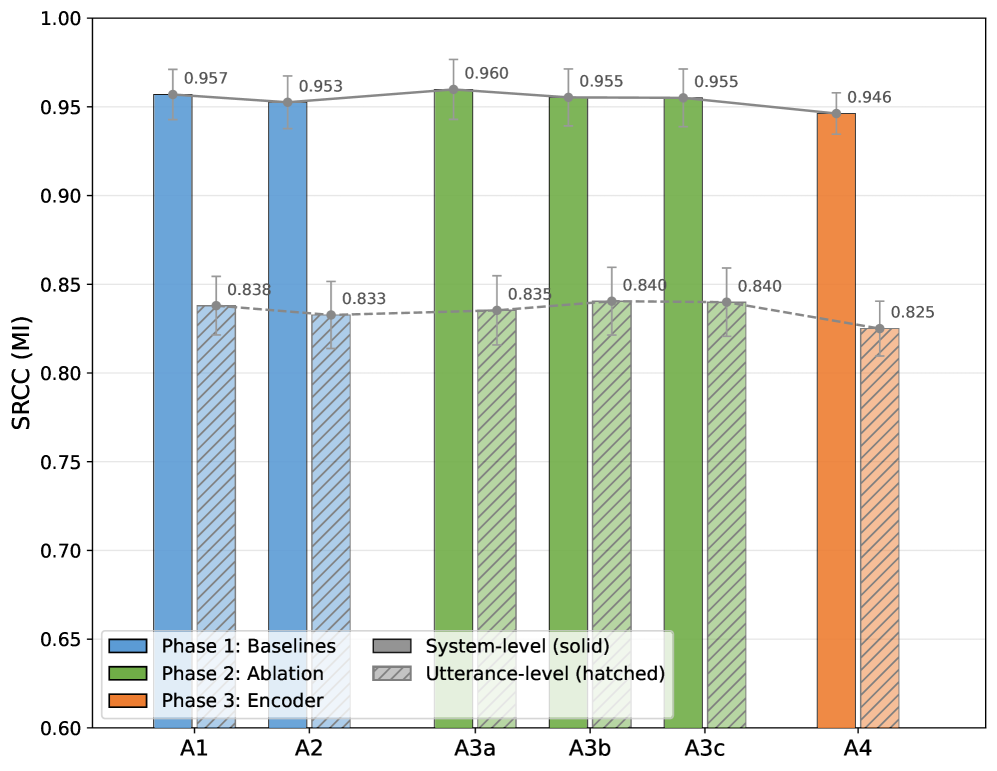
The chart compares the Sentence-Level Recall and Coherence (SRCC) metric (measured in MI) across four phases (A1-A4) and two system levels (system-level and utterance-level). System-level performance is represented by solid bars, while utterance-level performance uses hatched bars. Error bars indicate measurement uncertainty.
### Components/Axes
- **Y-axis**: SRCC (MI) values ranging from 0.60 to 1.00 in 0.05 increments.
- **X-axis**: Categories labeled A1, A2, A3a, A3b, A3c, and A4.
- **Legend**:
- Blue: Phase 1: Baselines
- Green: Phase 2: Ablation
- Orange: Phase 3: Encoder
- Solid: System-level (solid bars)
- Hatched: Utterance-level (hatched bars)
### Detailed Analysis
1. **Phase 1 (Baselines, Blue)**:
- **A1**: System-level = 0.957 (±0.005), Utterance-level = 0.838 (±0.005)
- **A2**: System-level = 0.953 (±0.005), Utterance-level = 0.833 (±0.005)
2. **Phase 2 (Ablation, Green)**:
- **A3a**: System-level = 0.960 (±0.005), Utterance-level = 0.835 (±0.005)
- **A3b**: System-level = 0.955 (±0.005), Utterance-level = 0.840 (±0.005)
- **A3c**: System-level = 0.955 (±0.005), Utterance-level = 0.840 (±0.005)
3. **Phase 3 (Encoder, Orange)**:
- **A4**: System-level = 0.946 (±0.005), Utterance-level = 0.825 (±0.005)
### Key Observations
- **System-level dominance**: Solid bars (system-level) consistently outperform hatched bars (utterance-level) across all categories, with a maximum gap of ~0.12 MI (A1).
- **Phase 2 peak**: The highest system-level performance (0.960 MI) occurs in A3a (Phase 2), suggesting ablation in this phase optimizes performance.
- **Utterance-level plateau**: Utterance-level values stabilize at 0.840 MI in A3b/A3c (Phase 2) before dropping to 0.825 MI in A4 (Phase 3).
- **Phase 3 regression**: System-level performance declines from 0.955 MI (A3c) to 0.946 MI (A4), indicating potential degradation in the encoder phase.
### Interpretation
The data demonstrates that system-level SRCC consistently exceeds utterance-level performance, emphasizing the importance of holistic system design over isolated utterance optimization. The peak in Phase 2 (A3a) suggests ablation techniques in this phase yield optimal results, while the Phase 3 decline may indicate over-optimization or architectural trade-offs. The stable utterance-level performance across A3b/A3c implies that utterance-specific improvements plateau early, leaving system-level adjustments as the primary lever for enhancement. The error bars (all ±0.005) indicate high measurement precision, reinforcing the reliability of these trends.