## Tactile Sensor Array and Computing System Diagram
### Overview
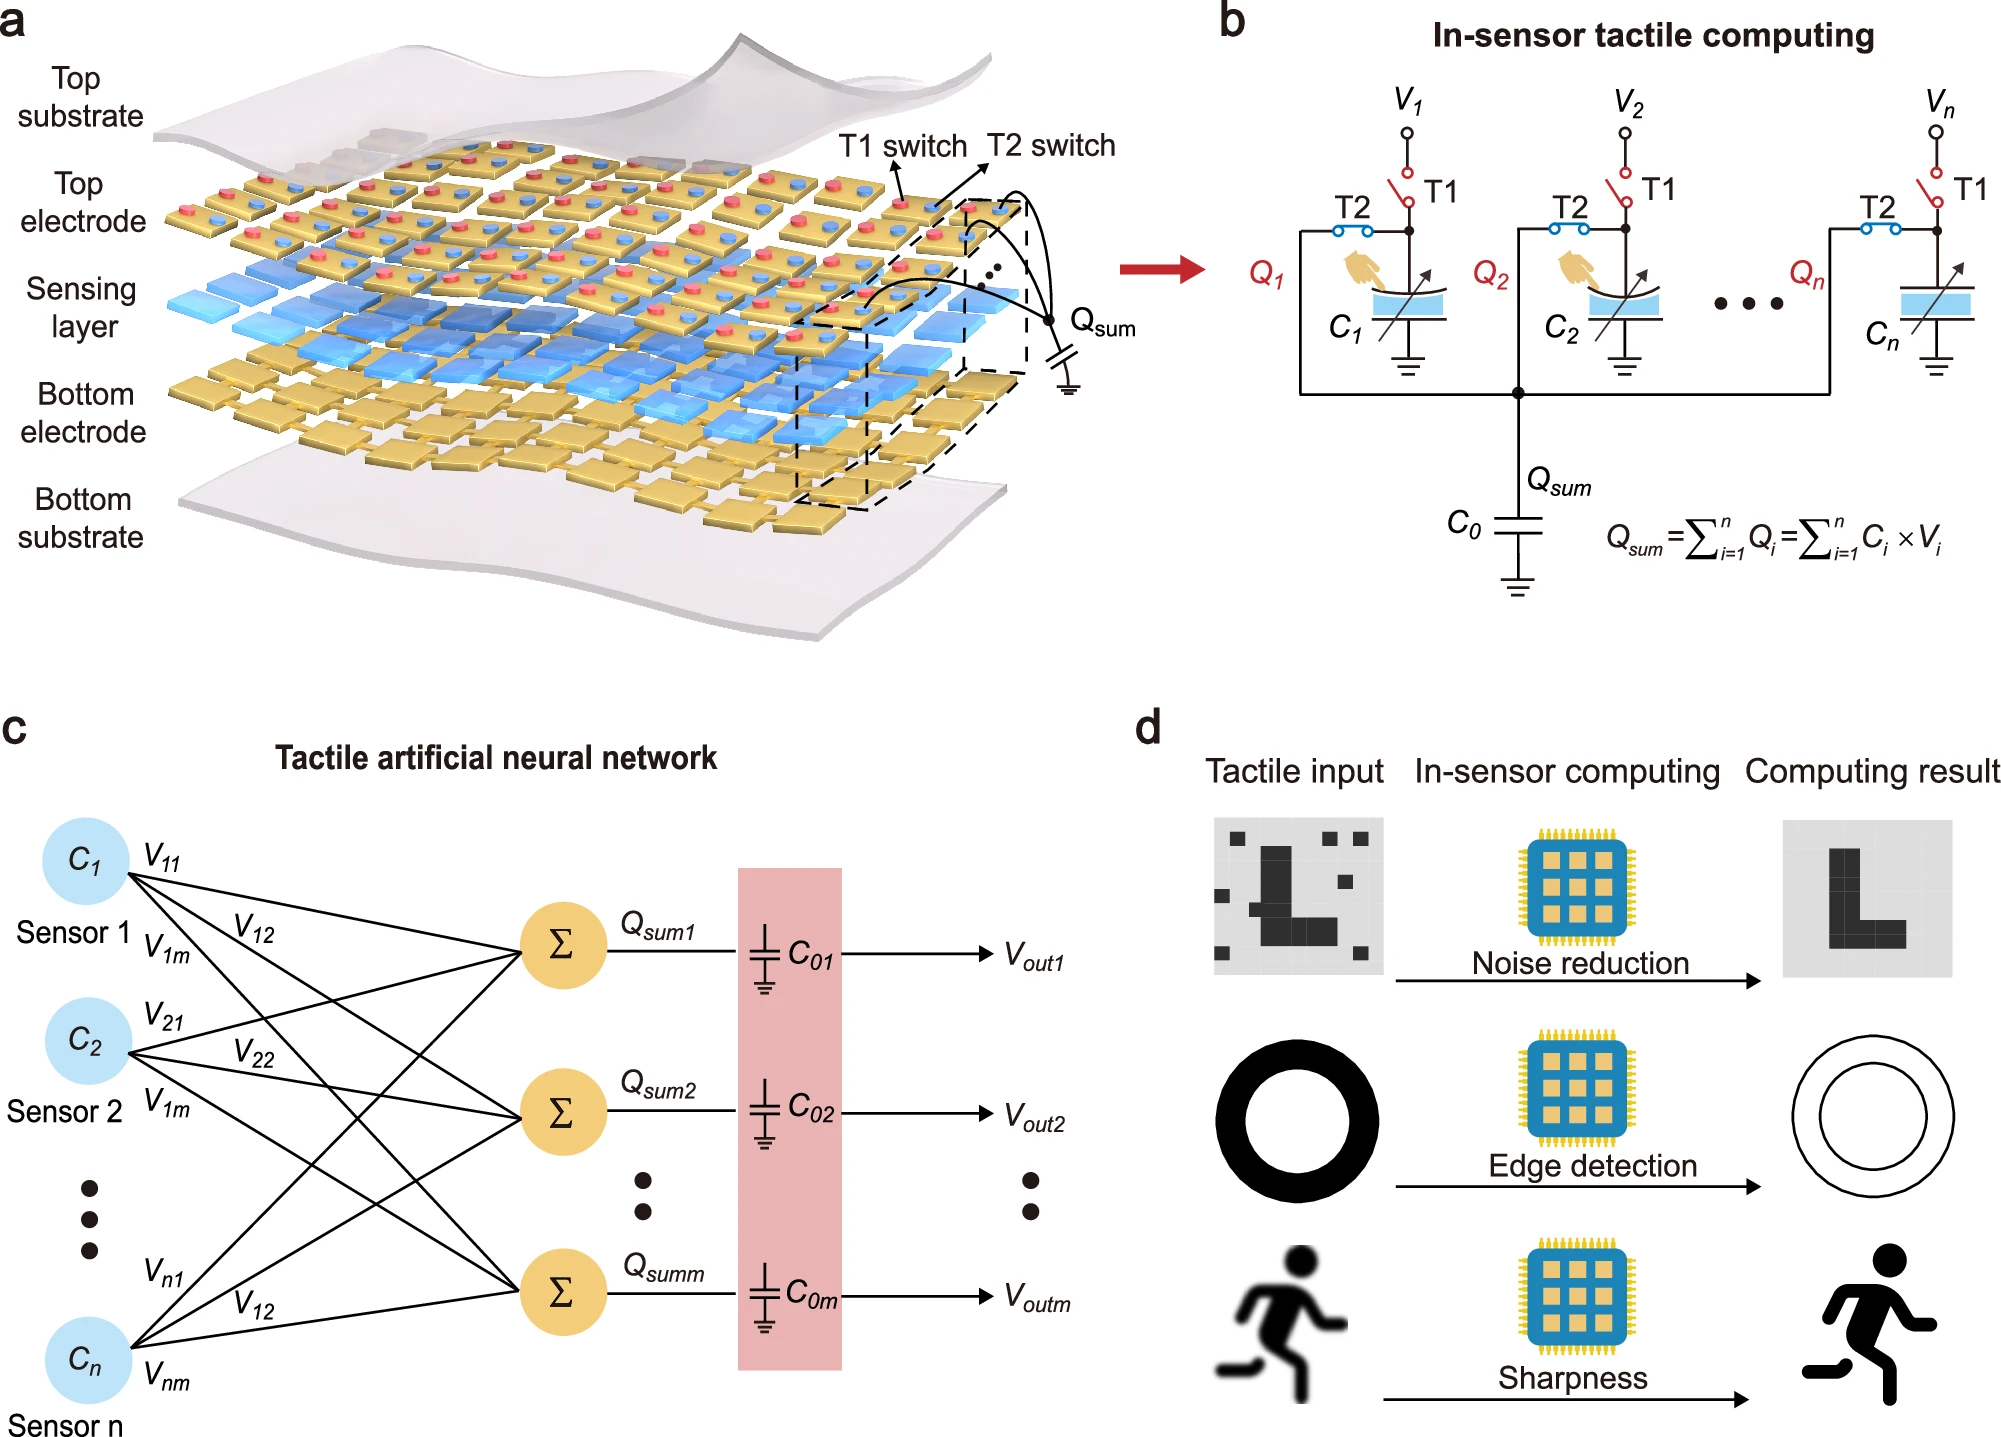
The image depicts a multi-stage tactile computing system comprising a tactile sensor array, in-sensor computing circuitry, an artificial neural network, and tactile input/output processing stages. The system demonstrates signal transduction from physical touch to symbolic output representations.
### Components/Axes
**Section a: Tactile Sensor Array**
- **Layers**:
- Top substrate (gray)
- Top electrode (gold squares with red/blue dots)
- Sensing layer (blue squares)
- Bottom electrode (gold squares)
- Bottom substrate (gray)
- **Key Elements**:
- T1/T2 switches (red/yellow)
- Q_sum summation node (black arrow)
- Voltage sources (V1, V2, ..., Vn)
- Capacitors (C1, C2, ..., Cn)
**Section b: In-Sensor Computing**
- **Circuit Components**:
- Transistors (T1, T2)
- Capacitors (C1, C2, ..., Cn)
- Voltage sources (V1, V2, ..., Vn)
- Summation node (Q_sum)
- **Formula**:
- Q_sum = Σ(C_i × V_i) from i=1 to n
**Section c: Tactile Artificial Neural Network**
- **Architecture**:
- Sensor nodes (C1, C2, ..., Cn)
- Voltage connections (V11, V12, ..., Vnm)
- Summation nodes (Q_sum1, Q_sum2, ..., Q_summ)
- Output capacitors (C01, C02, ..., C0m)
- Output voltages (V_out1, V_out2, ..., V_outm)
**Section d: Tactile Input/Output Processing**
- **Input**:
- Tactile grid with black/white squares
- **Processing Stages**:
1. Noise reduction (blue chip)
2. Edge detection (blue chip)
3. Sharpness analysis (blue chip)
- **Output Symbols**:
- 'L' character
- Circle
- Running figure
### Detailed Analysis
**Tactile Sensor Array (a)**
- Top/bottom electrodes (gold) sandwich sensing layer (blue)
- T1/T2 switches connect sensing layer to voltage sources
- Q_sum integrates signals from multiple electrodes
**In-Sensor Computing (b)**
- Parallel capacitor networks (C1-Cn) process individual voltage inputs
- Summation node aggregates charge from all sensors
- Circuit topology suggests analog signal processing
**Neural Network (c)**
- Fully connected architecture with cross-coupled connections
- Multiple summation layers (Q_sum1-Q_summ) process sensor data
- Output capacitors (C01-C0m) filter processed signals
**Input/Output Processing (d)**
- Tactile grid input represents physical contact patterns
- Three-stage processing pipeline:
- Noise reduction: Eliminates irrelevant signals
- Edge detection: Identifies boundary features
- Sharpness analysis: Determines contact intensity
- Symbolic outputs map to specific tactile features
### Key Observations
1. **Signal Flow**: Physical touch → Sensor array → In-sensor charge calculation → Neural processing → Symbolic output
2. **Component Color Coding**:
- Red/yellow: Switches (T1/T2)
- Blue: Sensing layer/capacitors
- Gold: Electrodes
3. **Neural Network Complexity**: Cross-connections between sensors suggest feature extraction capabilities
4. **Output Symbolism**: Simple geometric shapes represent abstracted tactile features
### Interpretation
This system demonstrates a complete tactile computing pipeline from physical interaction to symbolic representation. The tactile sensor array converts mechanical pressure into electrical signals through capacitive sensing. In-sensor computing performs initial charge summation, while the artificial neural network processes these signals through multiple layers to extract meaningful features. The final processing stages translate these features into recognizable symbols (letters, shapes, figures), suggesting applications in tactile communication systems or assistive technologies for visually impaired users. The use of both analog (capacitive sensing) and digital (neural network) processing stages indicates a hybrid approach to tactile signal interpretation.