## Scatter Plot & Line Graph: Performance vs. Decoding Acceleration & TPoT vs. Decoding Length
### Overview
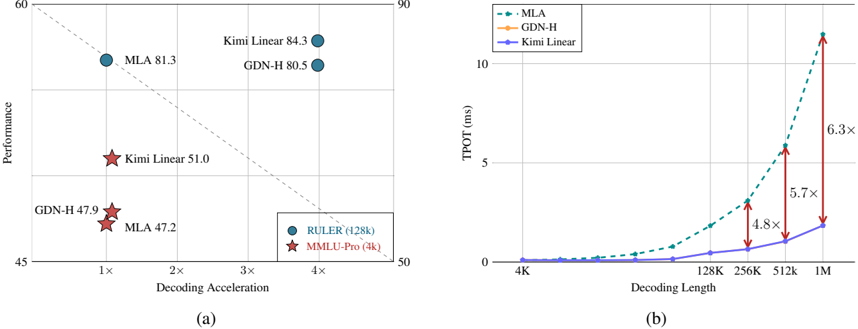
The image presents two related charts. The left chart (a) is a scatter plot showing the relationship between Decoding Acceleration and Performance for different models (MLA, GDN-H, Kimi Linear). The right chart (b) is a line graph illustrating the Time to Peak Output Token (TPoT) in milliseconds (ms) against Decoding Length, again for the same models. Both charts appear to be evaluating the efficiency and speed of different decoding methods.
### Components/Axes
**Chart (a):**
* **X-axis:** Decoding Acceleration (ranging approximately from 0 to 5x).
* **Y-axis:** Performance (ranging approximately from 45 to 90).
* **Data Points:** Represented by circles and stars, labeled with model names and values.
* **Legend:** Indicates the models:
* Blue Circles: MLA (428k)
* Red Stars: MMILU-Pro (4k)
* Blue Circles: Kimi Linear (428k)
* Blue Circles: GDN-H (428k)
* **Trend Line:** A dashed gray line showing a negative correlation between Decoding Acceleration and Performance.
**Chart (b):**
* **X-axis:** Decoding Length (ranging from 4K to 1M, with markers at 4K, 128K, 256K, 512K, and 1M). The scale is logarithmic.
* **Y-axis:** TPoT (ms) (ranging approximately from 0 to 12 ms). The scale is linear.
* **Data Series:** Three lines representing different models.
* **Legend:** Located in the top-right corner:
* Dashed Blue Line: MLA
* Dashed Orange Line: GDN-H
* Solid Blue Line: Kimi Linear
* **Arrows:** Red arrows indicating the increase in TPoT for MLA from 512K to 1M, with a factor of 6.3x. Another arrow indicates the increase in TPoT for GDN-H from 512K to 1M, with a factor of 5.7x. A third arrow indicates the increase in TPoT for Kimi Linear from 512K to 1M, with a factor of 4.8x.
### Detailed Analysis or Content Details
**Chart (a):**
* **MLA:** Located at approximately (1x, 81.3).
* **GDN-H:** Two points are present: (1x, 47.9) and (4x, 80.5).
* **Kimi Linear:** Two points are present: (1x, 51.0) and (4x, 84.3).
* The trend line shows that as Decoding Acceleration increases, Performance generally decreases.
**Chart (b):**
* **MLA (Dashed Blue):** Starts at approximately (4K, 0.2 ms) and increases rapidly after 256K, reaching approximately (1M, 11.5 ms).
* **GDN-H (Dashed Orange):** Starts at approximately (4K, 0.2 ms) and increases rapidly after 256K, reaching approximately (1M, 7.5 ms).
* **Kimi Linear (Solid Blue):** Starts at approximately (4K, 0.2 ms) and increases gradually, reaching approximately (1M, 5.5 ms).
* All three lines show a relatively flat trend up to 256K, after which they begin to curve upwards significantly.
### Key Observations
* In Chart (a), GDN-H and Kimi Linear show a trade-off between Decoding Acceleration and Performance. Higher acceleration leads to lower performance.
* In Chart (b), MLA exhibits the highest TPoT at 1M Decoding Length, followed by GDN-H, and then Kimi Linear.
* The increase in TPoT for all models is more pronounced at larger Decoding Lengths (512K and 1M).
* The TPoT values are very low for all models up to 256K Decoding Length.
### Interpretation
The data suggests that different decoding methods have varying performance characteristics. MLA achieves high performance at low decoding acceleration but suffers from a significant increase in TPoT as the decoding length increases. GDN-H and Kimi Linear offer a trade-off, allowing for higher decoding acceleration at the cost of some performance. Kimi Linear appears to be the most efficient in terms of TPoT, especially at larger decoding lengths.
The relationship between the two charts is that the performance gains achieved by MLA at lower decoding acceleration come at the cost of increased latency (TPoT) for longer sequences. The trend lines in both charts highlight the inherent trade-offs in decoding algorithms – optimizing for speed versus optimizing for efficiency. The logarithmic scale on the x-axis of chart (b) emphasizes the rapid increase in TPoT as decoding length approaches 1M, suggesting a potential bottleneck in processing very long sequences. The arrows quantifying the increase in TPoT from 512K to 1M provide a clear indication of the scalability challenges associated with each model.