## Scatter Plot and Line Graph: Model Performance vs. Decoding Efficiency
### Overview
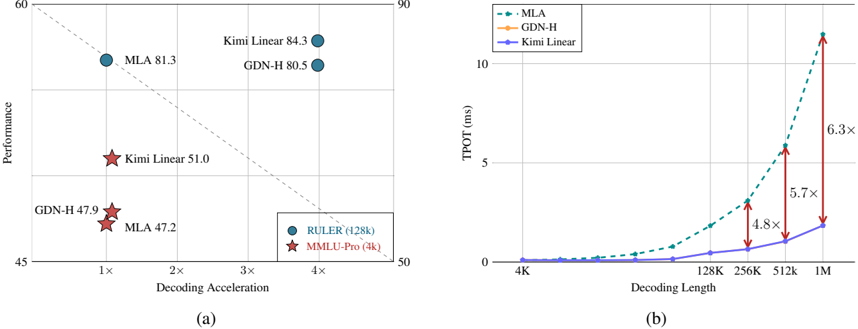
The image contains two charts:
- **Chart (a)**: A scatter plot comparing model performance (y-axis) against decoding acceleration (x-axis).
- **Chart (b)**: A line graph showing time-to-process (TPOT) in milliseconds (y-axis) as decoding length increases (x-axis).
---
### Components/Axes
#### Chart (a):
- **X-axis**: "Decoding Acceleration" (multiples: 1×, 2×, 3×, 4×).
- **Y-axis**: "Performance" (range: 45–60).
- **Legend**:
- **Blue circles**: RULER (128k)
- **Red stars**: MMLU-Pro (4k)
- **Dashed line**: A reference trend line from (1×, 50) to (4×, 55).
#### Chart (b):
- **X-axis**: "Decoding Length" (4K, 128K, 256K, 512K, 1M).
- **Y-axis**: "TPOT (ms)" (range: 0–10).
- **Legend**:
- **Blue dashed line**: MLA
- **Orange line**: GDN-H
- **Purple line**: Kimi Linear
---
### Detailed Analysis
#### Chart (a):
- **Data Points**:
- **MLA**: 81.3 (1×), 47.2 (4×).
- **Kimi Linear**: 84.3 (1×), 51.0 (4×).
- **GDN-H**: 80.5 (1×), 47.9 (4×).
- **Trends**:
- Performance decreases as decoding acceleration increases (e.g., MLA drops from 81.3 to 47.2).
- The dashed line suggests a linear trade-off between acceleration and performance.
#### Chart (b):
- **Trends**:
- All models show increasing TPOT with decoding length.
- **MLA** has the steepest slope (6.3× slower at 1M vs. 4K).
- **Kimi Linear** has the slowest growth (5.7× at 1M).
- **Annotations**:
- Multipliers (e.g., 6.3×) indicate performance degradation relative to a baseline.
---
### Key Observations
1. **Chart (a)**:
- Models with higher initial performance (e.g., Kimi Linear at 84.3) degrade more sharply with acceleration.
- The dashed line implies a theoretical maximum performance for a given acceleration.
2. **Chart (b)**:
- MLA’s TPOT grows exponentially, suggesting poor scalability.
- Kimi Linear maintains relatively stable efficiency.
---
### Interpretation
- **Chart (a)** highlights a trade-off between model performance and computational efficiency. Higher-performing models (e.g., Kimi Linear) may require more resources to maintain accuracy.
- **Chart (b)** demonstrates that MLA’s performance degrades significantly with longer decoding lengths, while Kimi Linear scales more gracefully.
- **Inconsistency Note**: The legend in Chart (a) labels "RULER (128k)" and "MMLU-Pro (4k)" but does not directly correspond to the model names (MLA, Kimi Linear, GDN-H). This may indicate a mislabeling or contextual mismatch in the visualization.
---
**Final Output**: The charts emphasize the balance between model accuracy and computational cost, with Kimi Linear emerging as a more efficient choice for longer decoding tasks.