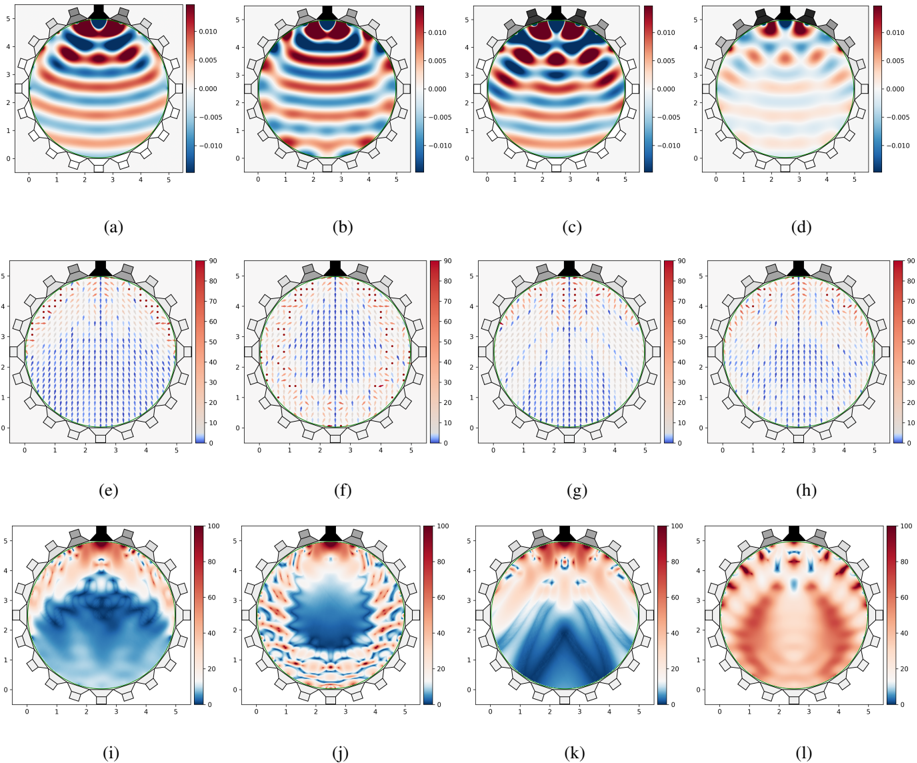
## Chart/Diagram Type: Multiple Circular Heatmaps and Vector Fields
### Overview
The image presents a 3x4 grid of circular plots. The top row shows heatmaps with a color scale ranging from blue to red, representing values from -0.010 to 0.010. The middle row displays vector fields within similar circular boundaries, accompanied by a color scale from 0 to 90. The bottom row shows heatmaps with a color scale ranging from blue to red, representing values from 0 to 100. Each plot is labeled with a letter from (a) to (l) at the bottom. The plots appear to represent different states or configurations of a system, possibly related to wave propagation or field distribution within a circular domain.
### Components/Axes
* **Circular Plots:** Each plot features a circular boundary, likely representing a physical domain.
* **X and Y Axes:** Each plot has x and y axes ranging from 0 to 5.
* **Top Row Color Scale:** Ranges from -0.010 (blue) to 0.010 (red).
* **Middle Row Color Scale:** Ranges from 0 (blue) to 90 (red).
* **Bottom Row Color Scale:** Ranges from 0 (blue) to 100 (red).
* **Vector Fields (Middle Row):** Arrows indicate direction and magnitude.
* **Labels:** Each plot is labeled (a) through (l).
* **Outer Ring:** Each circular plot has a ring of small gray squares around the circumference.
* **Top Center Shapes:** Each plot has a black shape at the top center, possibly representing an electrode or source.
### Detailed Analysis or ### Content Details
**Top Row (Heatmaps: -0.010 to 0.010)**
* **(a):** Shows a horizontal wave pattern with alternating blue and red regions. The red regions are concentrated near the top and bottom.
* **(b):** Similar to (a), but the wave pattern is slightly shifted and distorted.
* **(c):** Shows a more complex wave pattern with multiple alternating blue and red regions. The red regions are more concentrated near the top.
* **(d):** Shows a less defined wave pattern with smaller, more localized blue and red regions.
**Middle Row (Vector Fields: 0 to 90)**
* **(e):** Vectors generally point upwards and outwards from the center, with higher magnitudes (redder colors) near the top.
* **(f):** Vectors are more concentrated towards the top, with a radial pattern.
* **(g):** Vectors are primarily directed upwards, with a focus towards the center.
* **(h):** Vectors show a more dispersed pattern, with some pointing inwards and others outwards.
**Bottom Row (Heatmaps: 0 to 100)**
* **(i):** Shows a concentration of high values (red) at the top, with a gradual decrease towards the bottom (blue).
* **(j):** Shows a more complex pattern with alternating high and low values.
* **(k):** Shows a strong concentration of high values (red) at the top, forming a cone-like shape.
* **(l):** Shows a more uniform distribution of values, with a slight concentration of high values (red) at the center.
### Key Observations
* The top row shows wave-like patterns with varying degrees of complexity.
* The middle row shows vector fields with different directional patterns and magnitudes.
* The bottom row shows heatmaps with varying distributions of high and low values.
* The plots appear to represent different states or configurations of a system.
* The black shapes at the top center might be sources or electrodes influencing the patterns.
### Interpretation
The image likely represents simulations or experimental data related to wave propagation, field distribution, or some other physical phenomenon within a circular domain. The different plots (a-l) could represent different time steps, parameter settings, or experimental conditions. The heatmaps in the top and bottom rows likely represent the magnitude of a scalar field, while the vector fields in the middle row represent the direction and magnitude of a vector field. The black shapes at the top center could be sources or electrodes that are generating or influencing the fields. The variations in the patterns across the plots suggest that the system is dynamic and responsive to changes in its environment or parameters. Further context is needed to fully understand the specific phenomenon being represented and the meaning of the different plots.