\n
## Heatmaps: Wave Propagation/Distribution Analysis
### Overview
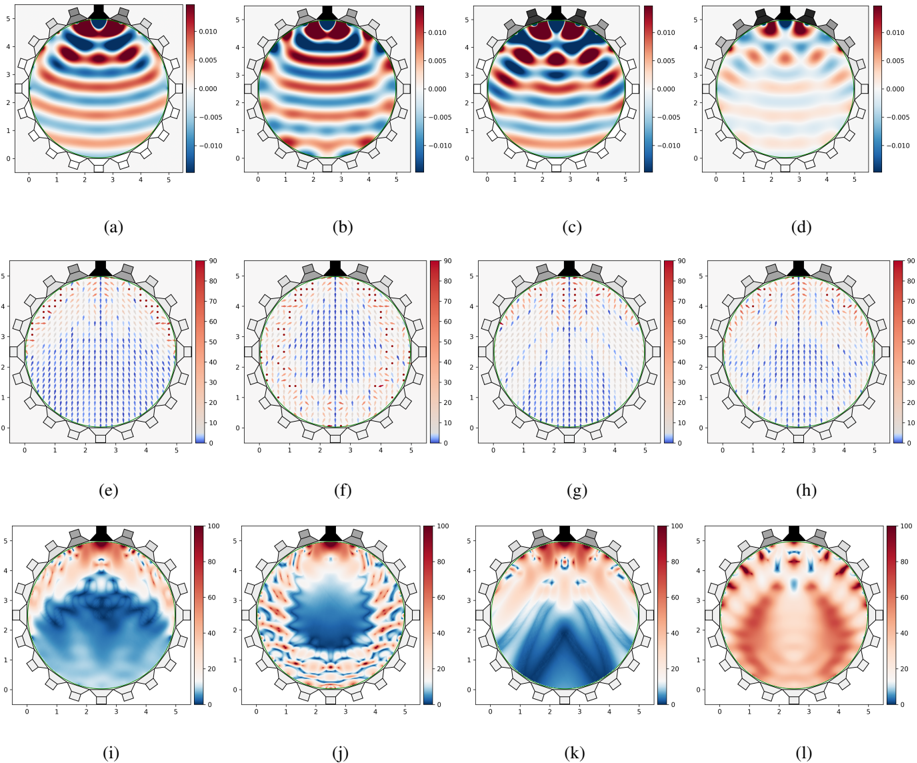
The image presents a 4x3 grid of heatmaps, likely representing wave propagation or distribution patterns. Each heatmap displays a circular region with a color gradient indicating the magnitude of a value. The heatmaps are labeled (a) through (l) in the bottom-left corner of each plot. The x and y axes of each plot range from 0 to 5, with tick marks at integer values. Each heatmap also contains a circular boundary and a series of radial lines emanating from the center.
### Components/Axes
* **X-axis:** Ranges from 0 to 5, labeled with integer tick marks.
* **Y-axis:** Ranges from 0 to 5, labeled with integer tick marks.
* **Color Scales:** Each heatmap has a color scale on the right side, representing the magnitude of the values. The scales vary between the top row (a-d) and the bottom two rows (e-l).
* **(a-d):** Color scale ranges from -0.010 to 0.010, with blue representing negative values, red representing positive values, and white/yellow representing values close to zero.
* **(e-h):** Color scale ranges from 10 to 90, with blue representing lower values and red representing higher values.
* **(i-l):** Color scale ranges from 10 to 100, with blue representing lower values and red representing higher values.
* **Labels:** Each heatmap is labeled with a letter from (a) to (l).
* **Circular Boundary:** A black circle defines the region of interest in each heatmap.
* **Radial Lines:** Lines radiating from the center of the circle, potentially indicating direction or angle.
### Detailed Analysis or Content Details
**Top Row (a-d):**
* **(a):** The heatmap shows a wave pattern with alternating positive (red) and negative (blue) regions. The maximum positive value is approximately 0.010, located at the top of the circle. The maximum negative value is approximately -0.010, located at the bottom of the circle.
* **(b):** Similar to (a), but the wave pattern is slightly shifted. Maximum positive value is approximately 0.010, located near the top-left. Maximum negative value is approximately -0.010, located near the bottom-right.
* **(c):** The wave pattern is further shifted. Maximum positive value is approximately 0.010, located near the center-right. Maximum negative value is approximately -0.010, located near the center-left.
* **(d):** The wave pattern is again shifted. Maximum positive value is approximately 0.010, located near the bottom-right. Maximum negative value is approximately -0.010, located near the top-left.
**Second Row (e-h):**
* **(e):** The heatmap shows a radial gradient with values increasing from the center (blue, ~10) to the periphery (red, ~90). The radial lines are aligned with the gradient.
* **(f):** Similar to (e), but the gradient is slightly distorted. Values range from approximately 10 in the center to 90 at the periphery.
* **(g):** The gradient is further distorted. Values range from approximately 10 in the center to 90 at the periphery.
* **(h):** The gradient is again distorted. Values range from approximately 10 in the center to 90 at the periphery.
**Third Row (i-l):**
* **(i):** The heatmap shows a complex pattern with a central blue region (values ~10-20) surrounded by a red ring (values ~80-100).
* **(j):** Similar to (i), but the central blue region is smaller and more elongated. Values range from approximately 10 to 100.
* **(k):** The central blue region is even smaller and more concentrated. Values range from approximately 10 to 100.
* **(l):** The central blue region is significantly reduced, and the red ring dominates. Values range from approximately 10 to 100.
### Key Observations
* The top row (a-d) displays oscillating wave patterns with relatively small magnitudes.
* The second row (e-h) shows radial gradients, indicating a source at the center.
* The third row (i-l) exhibits a combination of central low values and peripheral high values, suggesting a focusing or confinement effect.
* The color scales differ significantly between the rows, indicating different scales of measurement or different physical phenomena.
* The patterns in each row appear to evolve or shift across the heatmaps, suggesting a dynamic process.
### Interpretation
The image likely represents the simulation or measurement of wave behavior in a circular domain. The different rows could correspond to different time steps or different parameters in the simulation.
* **(a-d):** These heatmaps might represent the propagation of a wave with alternating phases, possibly an acoustic or electromagnetic wave. The shifting patterns suggest the wave is moving or changing its characteristics over time.
* **(e-h):** These heatmaps could represent the distribution of energy or intensity from a central source. The radial gradients indicate that the energy is spreading outwards.
* **(i-l):** These heatmaps suggest a focusing effect, where energy is concentrated at the periphery of the circle while being depleted in the center. This could be due to interference patterns or boundary conditions.
The evolution of the patterns across the heatmaps suggests a dynamic process, potentially involving wave interference, reflection, or absorption. The differences in color scales indicate that the magnitude of the values is changing over time or across different conditions. The radial lines might represent the direction of energy flow or the orientation of wave fronts. The overall image provides a visual representation of complex wave phenomena and could be used to analyze and understand their behavior.