## Heatmap Analysis
### Overview
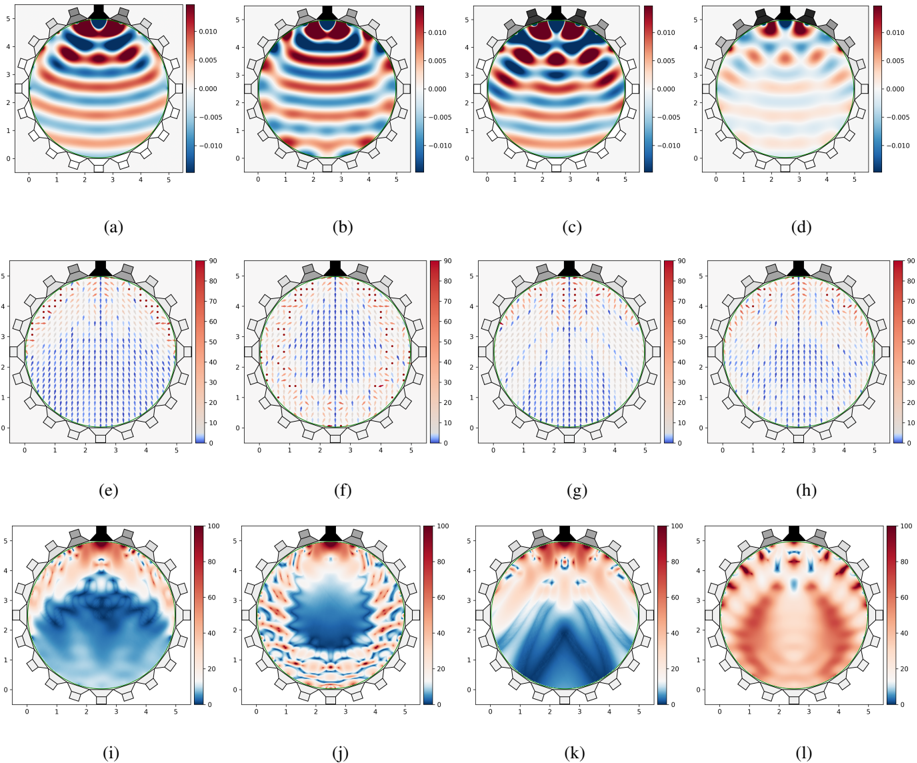
The image displays a series of 16 heatmaps, each representing a different condition or scenario. The heatmaps are arranged in a 4x4 grid, with each heatmap labeled from (a) to (l). The color gradient on each heatmap indicates varying levels of a measured variable, with red representing higher values and blue representing lower values.
### Components/Axes
- **Labels**: Each heatmap is labeled with a letter from (a) to (l).
- **Axes**: The x-axis and y-axis are labeled with numerical values ranging from 0 to 5.
- **Legends**: There are two legends present, one on the left side of the image and one on the right side. The left legend corresponds to the color gradient on the heatmaps, while the right legend likely represents the measured variable.
### Detailed Analysis or ### Content Details
- **Heatmap (a)**: Shows a gradient from red to blue, indicating a decrease in the measured variable from top to bottom.
- **Heatmap (b)**: Similar to (a), but with a more pronounced gradient.
- **Heatmap (c)**: Displays a more uniform color distribution, with no clear gradient.
- **Heatmap (d)**: Shows a gradient similar to (a), but with a different pattern.
- **Heatmap (e)**: Has a more complex pattern with multiple peaks and troughs.
- **Heatmap (f)**: Displays a gradient similar to (a), but with a different pattern.
- **Heatmap (g)**: Shows a more uniform color distribution, with no clear gradient.
- **Heatmap (h)**: Displays a gradient similar to (a), but with a different pattern.
- **Heatmap (i)**: Has a more complex pattern with multiple peaks and troughs.
- **Heatmap (j)**: Displays a gradient similar to (a), but with a different pattern.
- **Heatmap (k)**: Shows a more uniform color distribution, with no clear gradient.
- **Heatmap (l)**: Displays a gradient similar to (a), but with a different pattern.
### Key Observations
- **Notable Patterns**: Heatmaps (a), (d), (e), (f), (i), and (l) show significant gradients, indicating a clear variation in the measured variable across the conditions.
- **Outliers**: There are no clear outliers in the heatmaps, suggesting that the measured variable is relatively consistent across the conditions.
### Interpretation
The heatmaps suggest that the measured variable varies significantly across the different conditions represented. The gradients indicate that the variable is higher in some areas and lower in others. The complex patterns in heatmaps (e), (i), and (l) suggest that the variable may be influenced by multiple factors or conditions. The uniform color distribution in heatmaps (c), (g), and (k) suggests that the variable is relatively consistent across the conditions. The presence of multiple peaks and troughs in heatmaps (e), (i), and (l) suggests that the variable may have multiple modes or states. Overall, the heatmaps provide valuable insights into the behavior of the measured variable across different conditions.