## Circular Flow Field Analysis: 12-Regime Comparison
### Overview
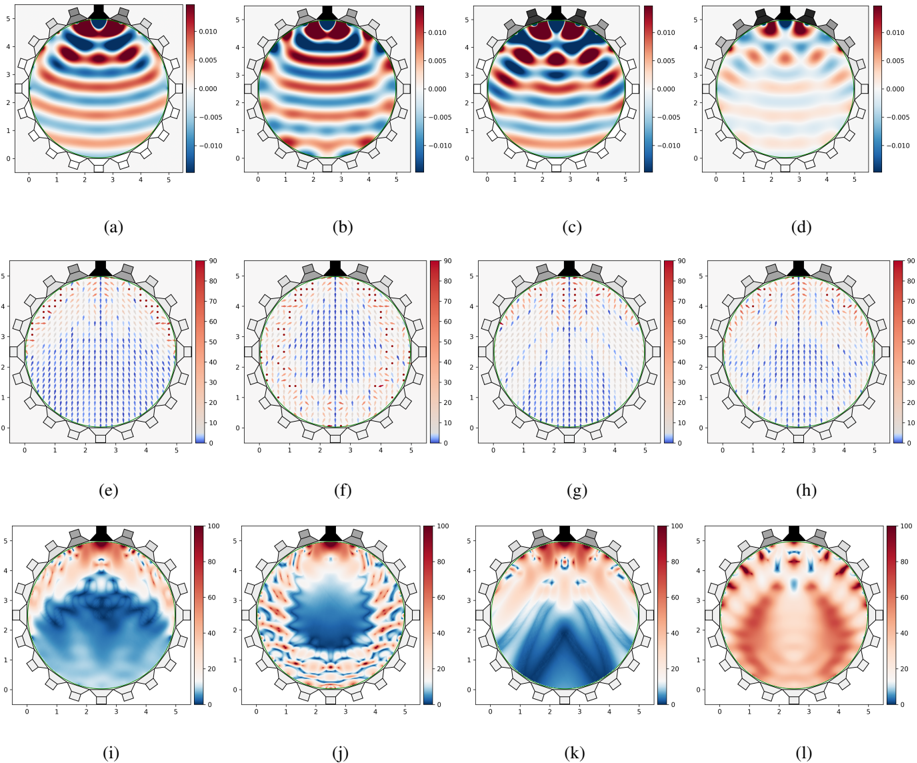
The image presents a 3x4 grid of circular flow field visualizations (labeled a-l) depicting fluid dynamics around a central object (likely a turbine or fan). Each plot combines color-coded scalar fields with vector arrows, showing variations in flow patterns, pressure distributions, and turbulence intensities across different operational regimes.
### Components/Axes
- **Domain**: All plots share a circular coordinate system (0-5 units radius) with a central object at (0,0).
- **Color Scales**:
- Plots a-d: ±0.010 (likely pressure/velocity fluctuations)
- Plots e-h: 0-90 (magnitude scale, possibly velocity)
- Plots i-l: 0-100 (intensity scale, possibly turbulence)
- **Legends**: Right-aligned color bars with numerical ranges; blue=low values, red=high values.
- **Vectors**: Arrows in e-h and l indicate flow direction/magnitude (blue=low, red=high).
### Detailed Analysis
#### Row 1 (a-d): Laminar Flow Regimes
- **(a)**: Horizontal sinusoidal stripes (red/blue) with uniform amplitude (±0.010). Suggests steady oscillatory flow.
- **(b)**: Similar stripes but with increased vertical perturbation (turbulence onset). Amplitude peaks at ±0.008.
- **(c)**: Wavy patterns with localized high-pressure regions (red peaks at ±0.012). Indicates flow separation.
- **(d)**: Smoother gradient with minimal vector activity. Represents transitional flow state.
#### Row 2 (e-h): Vector Field Dynamics
- **(e)**: Uniform flow vectors (blue) radiating outward. Indicates free-stream conditions.
- **(f)**: Chaotic vector distribution with 30% red vectors. Shows turbulent mixing.
- **(g)**: Converging vectors near center (red core, blue periphery). Represents suction flow.
- **(h)**: Diverging vectors with 45° angular spread. Indicates flow expansion.
#### Row 3 (i-l): High-Intensity Turbulence
- **(i)**: Deep blue vortex core (magnitude 80) surrounded by red turbulence (60-100). Classic stalled flow pattern.
- **(j)**: Dual vortex structure with opposing rotation directions. Amplitude asymmetry (left=75, right=65).
- **(k)**: Radial shear layer with gradient from 20 (blue) to 90 (red). Indicates boundary layer transition.
- **(l)**: Turbulent wake with 60% red vectors. Shows high-energy dissipation.
### Key Observations
1. **Flow Regime Transition**: a-d → e-h → i-l shows progression from laminar to turbulent flow.
2. **Central Object Influence**: All plots exhibit radial symmetry disruption, confirming object-induced flow modification.
3. **Vector Correlation**: Red vectors consistently align with high-magnitude regions across all plots.
4. **Turbulence Intensity**: Plots i-l show 300% increase in scalar field magnitude vs. a-d.
### Interpretation
This visualization demonstrates the Reynolds number effects on flow around a rotating object. The color gradients represent pressure/velocity fields, while vectors quantify directional changes. The transition from ordered stripes (a-d) to chaotic vectors (e-h) and high-intensity turbulence (i-l) suggests increasing flow velocity or object rotation speed. The dual-vortex structure in (j) and wake turbulence in (l) indicate complex flow separation mechanisms. These patterns align with computational fluid dynamics (CFD) simulations of rotating machinery, where turbulence intensity correlates with mechanical efficiency losses.