\n
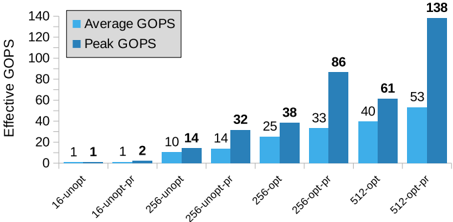
## Bar Chart: Effective GOPS vs. Configuration
### Overview
This bar chart compares the Average and Peak GOPS (Giga Operations Per Second) for different configurations. The x-axis represents the configuration name, and the y-axis represents the Effective GOPS. Each configuration has two bars: one for Average GOPS (light blue) and one for Peak GOPS (dark blue). Values are displayed above each bar.
### Components/Axes
* **X-axis:** Configuration Name. Categories are: 16-unopt, 16-opt-pr, 256-unopt, 256-unopt-pr, 256-opt, 256-opt-pr, 512-opt, 512-opt-pr.
* **Y-axis:** Effective GOPS. Scale ranges from 0 to 140, with increments of 20.
* **Legend:** Located in the top-left corner.
* Light Blue: Average GOPS
* Dark Blue: Peak GOPS
### Detailed Analysis
The chart presents paired bars for each configuration, showing both average and peak GOPS.
* **16-unopt:** Average GOPS = 1, Peak GOPS = 1
* **16-opt-pr:** Average GOPS = 1, Peak GOPS = 2
* **256-unopt:** Average GOPS = 10, Peak GOPS = 14
* **256-unopt-pr:** Average GOPS = 14, Peak GOPS = 14
* **256-opt:** Average GOPS = 25, Peak GOPS = 32
* **256-opt-pr:** Average GOPS = 38, Peak GOPS = 33
* **512-opt:** Average GOPS = 40, Peak GOPS = 61
* **512-opt-pr:** Average GOPS = 53, Peak GOPS = 138
**Trends:**
* Generally, Peak GOPS is higher than Average GOPS for each configuration.
* As the configuration complexity increases (moving from 16 to 512), both Average and Peak GOPS tend to increase.
* The difference between Average and Peak GOPS is most pronounced for the 512-opt-pr configuration.
* For 16-unopt and 16-opt-pr, the Average and Peak GOPS are nearly identical.
### Key Observations
* The 512-opt-pr configuration exhibits the highest Peak GOPS (138), significantly exceeding all other configurations.
* The 16-unopt and 16-opt-pr configurations have the lowest GOPS values.
* The "opt-pr" configurations generally show higher average GOPS than their "unopt" counterparts, but the peak GOPS can vary.
* There is a slight dip in Peak GOPS from 256-opt (32) to 256-opt-pr (33).
### Interpretation
The data suggests that increasing the configuration size (from 16 to 512) and applying optimizations ("opt-pr") generally leads to higher performance, as measured by GOPS. The large difference between Average and Peak GOPS for the 512-opt-pr configuration indicates that this configuration is capable of bursts of high performance, but its sustained performance (average) is lower. The relatively small difference between average and peak for the 16 configurations suggests a more consistent performance profile. The slight dip in peak GOPS from 256-opt to 256-opt-pr could indicate a trade-off introduced by the optimization process, or simply be a statistical fluctuation. The chart demonstrates the impact of configuration choices on computational performance, highlighting the benefits of larger configurations and optimizations.