## Bar Chart: Effective GOPS by Configuration
### Overview
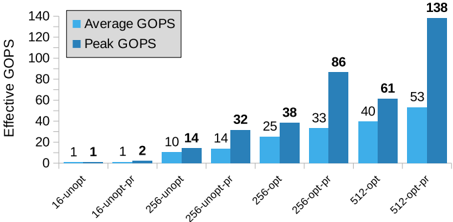
The image displays a bar chart comparing "Average GOPS" and "Peak GOPS" across eight different computational configurations. The chart demonstrates the performance impact of optimization (`-opt`) and prefetching (`-pf`) on systems with different base parameters (16, 256, 512).
### Components/Axes
* **Chart Title:** None visible.
* **Y-Axis:** Labeled "Effective GOPS". The scale runs from 0 to 140, with major tick marks every 20 units (0, 20, 40, 60, 80, 100, 120, 140).
* **X-Axis:** Lists eight configuration labels. From left to right:
1. `16-unopt`
2. `16-unopt-pf`
3. `256-unopt`
4. `256-unopt-pf`
5. `256-opt`
6. `256-opt-pf`
7. `512-opt`
8. `512-opt-pf`
* **Legend:** Positioned in the top-left corner of the chart area.
* Light Blue Square: "Average GOPS"
* Dark Blue Square: "Peak GOPS"
### Detailed Analysis
The chart presents paired bars for each configuration. The numerical value for each bar is explicitly labeled above it.
| Configuration | Average GOPS (Light Blue) | Peak GOPS (Dark Blue) |
| :--- | :--- | :--- |
| **16-unopt** | 1 | 1 |
| **16-unopt-pf** | 1 | 2 |
| **256-unopt** | 10 | 14 |
| **256-unopt-pf** | 14 | 32 |
| **256-opt** | 25 | 38 |
| **256-opt-pf** | 33 | 86 |
| **512-opt** | 40 | 61 |
| **512-opt-pf** | 53 | 138 |
**Trend Verification:**
* **General Trend:** Both Average and Peak GOPS show a clear upward trend moving from left to right across the configurations.
* **Impact of Prefetching (`-pf`):** For every base configuration (16, 256, 512), the addition of `-pf` increases both average and peak performance. The effect is most dramatic on the `256-opt-pf` and `512-opt-pf` configurations.
* **Impact of Optimization (`-opt`):** Comparing `256-unopt` to `256-opt` shows a significant performance increase. The jump from `256-opt` to `256-opt-pf` is even larger, especially for Peak GOPS.
* **Peak vs. Average:** Peak GOPS is always greater than or equal to Average GOPS. The gap between them widens substantially in the higher-performance configurations, particularly for `256-opt-pf` (33 vs. 86) and `512-opt-pf` (53 vs. 138).
### Key Observations
1. **Largest Performance Leap:** The single largest performance value is **138 Peak GOPS** for the `512-opt-pf` configuration.
2. **Most Significant Prefetching Gain:** The most dramatic relative increase from prefetching occurs between `256-opt` (Peak 38) and `256-opt-pf` (Peak 86), a **~126% increase**.
3. **Baseline Performance:** The `16-unopt` and `16-unopt-pf` configurations show minimal performance (1-2 GOPS), indicating a severe bottleneck at this base level.
4. **Consistent Pattern:** The pattern of `Configuration` -> `Configuration-pf` -> `Optimized Configuration` -> `Optimized Configuration-pf` shows a consistent and multiplicative performance improvement.
### Interpretation
This chart illustrates the performance scaling of a computational system, likely a processor or accelerator, measured in Giga Operations Per Second (GOPS). The data suggests several key insights:
* **Scalability:** Performance scales significantly with the base configuration number (16 -> 256 -> 512), indicating that the underlying hardware or parallelism model benefits from increased resources.
* **Critical Role of Software Tuning:** The massive gains from optimization (`-opt`) and especially from prefetching (`-pf`) demonstrate that raw hardware capability is underutilized without sophisticated software techniques. Prefetching, which hides memory latency by pre-loading data, appears to be the single most impactful optimization for peak throughput.
* **Performance Variability:** The large and growing gap between Average and Peak GOPS in advanced configurations indicates that performance is bursty. The system can achieve very high throughput for short periods (peak) but cannot sustain it, likely due to resource contention, memory bandwidth limits, or workload variability.
* **Bottleneck Identification:** The near-zero performance of the `16-` configurations suggests a fundamental bottleneck (e.g., insufficient threads, memory channels, or compute units) that prevents any meaningful work from being done, regardless of optimization.
In summary, the chart makes a compelling case for a holistic approach to performance engineering: combining scalable hardware resources (`512`) with aggressive, low-level software optimizations (`-opt-pf`) is necessary to unlock the highest levels of sustained and peak computational throughput.