## Bar Chart: Effective GOPS
### Overview
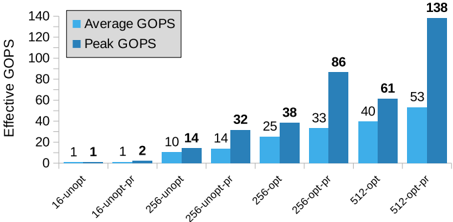
The chart compares **Average GOPS** and **Peak GOPS** across different computational configurations. It highlights performance metrics for systems with varying optimization levels and processing capacities (e.g., 16-unopt, 512-opt-pr). The y-axis represents "Effective GOPS" (Giga Operations Per Second), while the x-axis categorizes configurations by optimization and processing scale.
### Components/Axes
- **X-axis**: Configuration types (16-unopt, 16-unopt-pr, 256-unopt, 256-unopt-pr, 256-opt, 256-opt-pr, 512-opt, 512-opt-pr).
- **Y-axis**: "Effective GOPS" (linear scale from 0 to 140).
- **Legend**:
- **Blue (light)**: Average GOPS.
- **Dark Blue**: Peak GOPS.
- **Bar Style**: Grouped bars for each configuration, with Average GOPS on the left and Peak GOPS on the right.
### Detailed Analysis
- **16-unopt**: Average = 1, Peak = 1.
- **16-unopt-pr**: Average = 1, Peak = 2.
- **256-unopt**: Average = 10, Peak = 14.
- **256-unopt-pr**: Average = 14, Peak = 32.
- **256-opt**: Average = 25, Peak = 38.
- **256-opt-pr**: Average = 33, Peak = 86.
- **512-opt**: Average = 40, Peak = 61.
- **512-opt-pr**: Average = 53, Peak = 138.
### Key Observations
1. **Peak GOPS consistently exceed Average GOPS** across all configurations, with the gap widening as configurations scale (e.g., 512-opt-pr: Peak = 138 vs. Average = 53).
2. **Optimization impact**: Configurations with "opt" or "opt-pr" suffixes show significantly higher performance. For example:
- 256-opt-pr: Peak GOPS (86) is 2.6x higher than Average (33).
- 512-opt-pr: Peak GOPS (138) is 2.6x higher than Average (53).
3. **Scaling effect**: Larger configurations (512-opt-pr) achieve the highest metrics, with Peak GOPS reaching 138 (nearly 140 y-axis limit).
4. **Minimal performance**: The least optimized configurations (16-unopt, 16-unopt-pr) have negligible GOPS (1–2).
### Interpretation
The data demonstrates that **optimization and processing scale directly correlate with performance**. Configurations with "opt" or "opt-pr" (likely optimized or pre-optimized systems) achieve substantially higher Peak GOPS, suggesting these settings unlock latent computational capacity. The 512-opt-pr configuration stands out as the most performant, with Peak GOPS nearly tripling the Average. This implies that advanced optimization techniques (e.g., parallel processing, algorithmic improvements) are critical for maximizing throughput. The minimal performance of unoptimized configurations (16-unopt) highlights the importance of system tuning in high-demand scenarios.