\n
## Diagram: Insect Movement on a Grid
### Overview
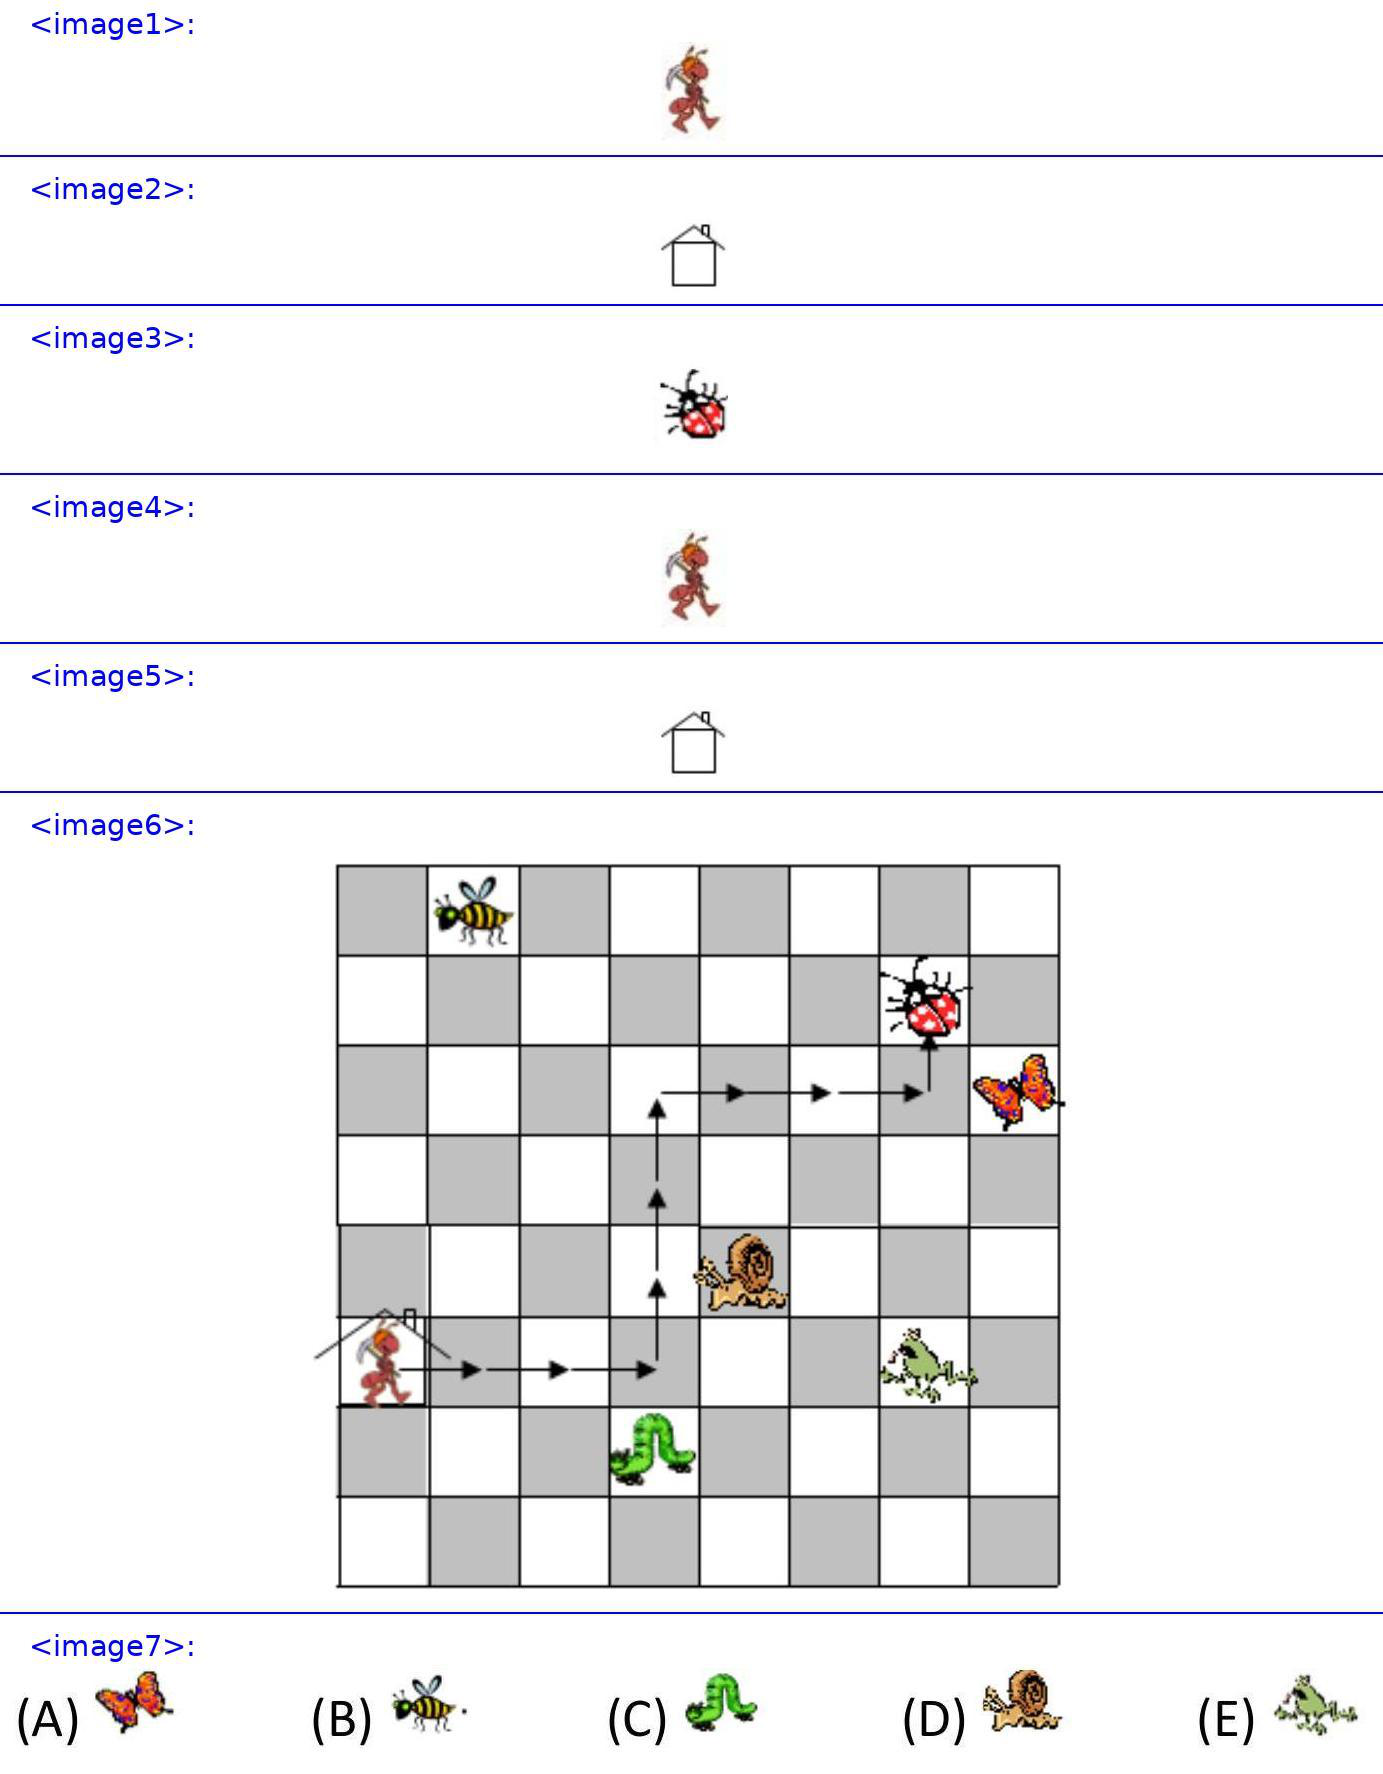
The image depicts a grid-based diagram illustrating the movement of various insects. The grid is 8x8 squares. Several insects are shown at different locations on the grid, with arrows indicating their movement direction. A legend at the bottom identifies each insect type. The diagram appears to represent a simulation or a visualization of insect paths.
### Components/Axes
The diagram consists of:
* **Grid:** An 8x8 grid of squares.
* **Insects:** Five different insect types are represented: Butterfly, Bee, House, Ladybug, and Caterpillar.
* **Arrows:** Black arrows indicate the direction of movement for each insect.
* **Legend:** Located at the bottom of the image, identifying each insect with a letter (A-E).
### Detailed Analysis or Content Details
The insects and their movements are as follows:
* **Butterfly (A):** Located approximately at the bottom-left corner (row 7, column 1). The arrow points upwards and slightly to the right.
* **Bee (B):** Located near the top-left corner (row 1, column 2). No arrow is associated with this insect.
* **Caterpillar (C):** Located approximately in the center of the grid (row 4, column 3). The arrow points upwards.
* **Ladybug (D):** Located near the top-right corner (row 1, column 7). The arrow points downwards and slightly to the left.
* **House (E):** Located approximately in the center-right of the grid (row 4, column 6). No arrow is associated with this insect.
The grid itself is visually divided into light and dark squares in a checkerboard pattern.
### Key Observations
* Most insects have a defined movement direction indicated by an arrow.
* The Bee and House do not have associated arrows, suggesting they are stationary or their movement is not being tracked.
* The arrows indicate a general upward trend in movement for the Butterfly and Caterpillar.
* The Ladybug is moving downwards.
### Interpretation
This diagram likely represents a simplified model of insect behavior within a defined space. The arrows suggest a directed movement, potentially influenced by external factors (e.g., food sources, obstacles). The absence of arrows for the Bee and House could indicate they represent fixed points or resources within the environment. The checkerboard pattern of the grid might represent different terrain types or environmental conditions.
The diagram could be used to illustrate concepts in:
* **Ecology:** Insect dispersal patterns.
* **Computer Science:** Pathfinding algorithms or agent-based modeling.
* **Game Design:** Simple AI movement patterns.
The diagram is a visual representation of a system, and the relationships between the insects and their environment are implied through their positions and movement directions. The lack of quantitative data (e.g., distances, speeds) limits the depth of analysis, but the diagram effectively conveys a qualitative understanding of insect movement within a grid-based environment.