## Diagram: ARC Example and Augmentation Process
### Overview
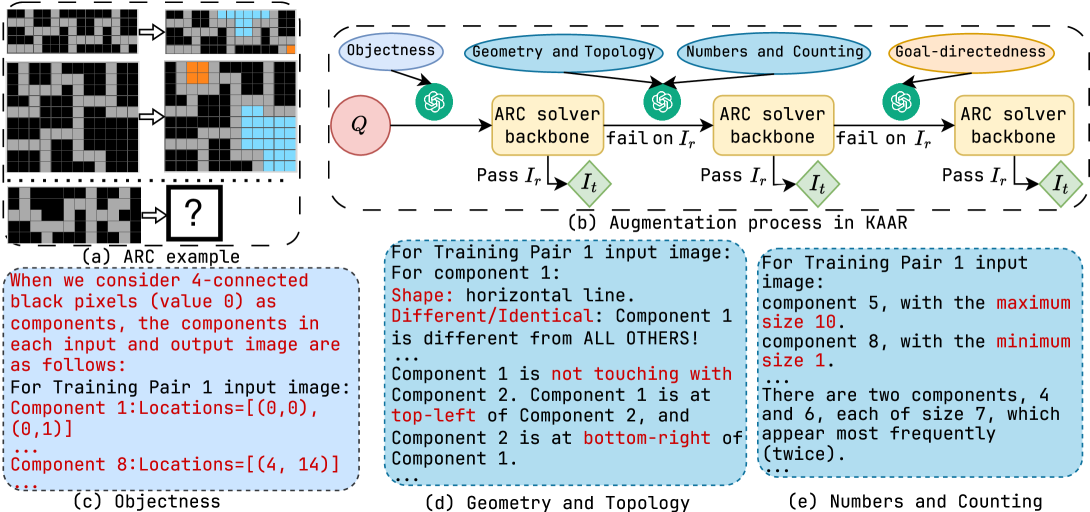
The image presents an example of an Abstraction and Reasoning Corpus (ARC) problem, along with a diagram illustrating an augmentation process using Knowledge-Augmented Abstract Reasoning (KAAR). It also includes descriptions related to objectness, geometry/topology, and number/counting aspects of the ARC problem.
### Components/Axes
* **(a) ARC example:** Shows three pairs of input-output grids. The first two pairs are complete, while the third pair has a question mark in the output grid, indicating the task is to predict the output. The grids consist of black, gray, and other colored cells.
* **(b) Augmentation process in KAAR:** A flowchart-like diagram showing the process of augmenting the ARC problem. It starts with a "Q" (likely representing the question or problem), which is fed into an "ARC solver backbone". The process includes checks for failure ("fail on Ir") and passing ("Pass Ir"), leading to iterative refinements. The output of each stage is denoted as "It". The process is enclosed in a dashed box.
* **(c) Objectness:** A text block describing how 4-connected black pixels (value 0) are considered components. It provides examples of component locations for Training Pair 1 input image, specifically Component 1: Locations=[(0,0), (0,1)] and Component 8: Locations=[(4, 14)].
* **(d) Geometry and Topology:** A text block describing the shape and relationship between components. For Training Pair 1 input image, it states that Component 1 has a horizontal line shape and is different from all others. It also specifies the relative positions of Component 1 and Component 2.
* **(e) Numbers and Counting:** A text block describing the size and frequency of components. For Training Pair 1 input image, it mentions component 5 with a maximum size of 10 and component 8 with a minimum size of 1. It also notes the presence of two components, 4 and 6, each of size 7, appearing most frequently (twice).
### Detailed Analysis
* **ARC Example (a):**
* The first input grid has a pattern of black and gray cells. The corresponding output grid has blue cells in place of some of the gray cells.
* The second input grid has a different pattern of black and gray cells. The corresponding output grid has blue and orange cells in place of some of the gray cells.
* The third input grid has a pattern of black and gray cells, and the corresponding output grid is marked with a question mark.
* **Augmentation Process (b):**
* The process starts with "Q" (red circle), which feeds into an "ARC solver backbone" (yellow rounded rectangle).
* A green circle with a chat bubble icon is placed above each "ARC solver backbone".
* The output of the backbone is checked for failure ("fail on Ir"). If it fails, the process loops back to the backbone.
* If it passes ("Pass Ir"), the output is "It" (green diamond).
* This process is repeated three times.
* **Objectness (c):**
* Defines components as 4-connected black pixels (value 0).
* Provides specific locations for components in Training Pair 1 input image.
* **Geometry and Topology (d):**
* Describes the shape and relationships between components.
* Component 1 is a horizontal line and is different from all others.
* Component 1 is not touching Component 2.
* Component 1 is at the top-left of Component 2, and Component 2 is at the bottom-right of Component 1.
* **Numbers and Counting (e):**
* Describes the size and frequency of components.
* Component 5 has a maximum size of 10.
* Component 8 has a minimum size of 1.
* Components 4 and 6, each of size 7, appear most frequently (twice).
### Key Observations
* The ARC example demonstrates a pattern recognition and reasoning task.
* The augmentation process uses an iterative approach to refine the solution.
* The descriptions of objectness, geometry/topology, and number/counting provide specific details about the components and their relationships.
### Interpretation
The image illustrates a system for solving ARC problems using an augmentation process. The ARC example highlights the type of pattern recognition and reasoning required. The augmentation process demonstrates an iterative approach to refining the solution, likely involving multiple attempts and checks for failure. The descriptions of objectness, geometry/topology, and number/counting provide specific details about the components and their relationships, which are likely used by the ARC solver backbone to generate the output. The system leverages different aspects of the problem (objectness, geometry, numbers) to improve its problem-solving capabilities.