\n
## Diagram: Visual Reasoning Components & Augmentation Process
### Overview
The image presents a breakdown of visual reasoning tasks, specifically focusing on the ARC (Abstract Reasoning Challenge) example, and the augmentation process used in KAAR (likely a system or method). It combines a visual example of an ARC puzzle, a diagram of the augmentation process, and textual descriptions of objectness, geometry/topology, and number/counting aspects.
### Components/Axes
The image is divided into five labeled sections:
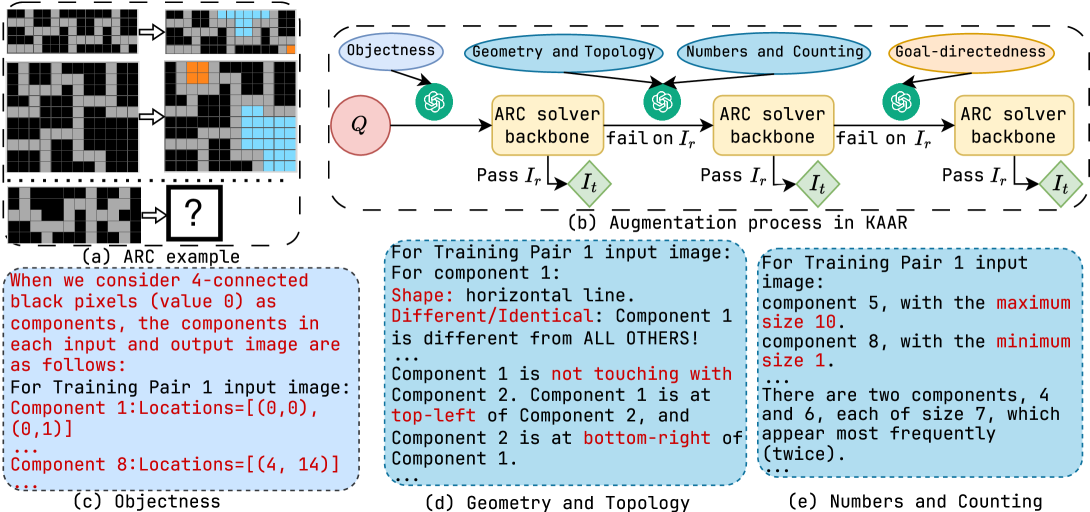
* **(a) ARC example:** A grid-based puzzle with black and white squares, and a question mark indicating the missing element.
* **(b) Augmentation process in KAAR:** A flow diagram illustrating the augmentation steps.
* **(c) Objectness:** Textual description of component identification.
* **(d) Geometry and Topology:** Textual description of component shape and relationships.
* **(e) Numbers and Counting:** Textual description of component sizes and frequencies.
The augmentation process diagram uses the following elements:
* Oval nodes representing stages: "Objectness", "Geometry and Topology", "Numbers and Counting", "Goal-directed".
* Circular nodes representing input images: labeled *I<sub>T</sub>*.
* Rectangular nodes representing the ARC solver backbone.
* Arrows indicating flow and success/failure paths ("Pass" or "fail on *I<sub>T</sub>*").
* A question mark symbol *Q* representing the unknown.
### Detailed Analysis or Content Details
**(a) ARC example:**
The grid is approximately 8x8. Black pixels have a value of 0, and white pixels have a value of 1. The puzzle has a missing square in the bottom-right corner, marked with a question mark. The pattern appears to involve alternating black and white blocks, with some variations.
**(b) Augmentation process in KAAR:**
The diagram shows a cyclical process.
1. The process starts with an input image *I<sub>T</sub>*.
2. It passes through "Objectness", then to "Geometry and Topology", then to "Numbers and Counting", and finally to "Goal-directed".
3. The output of "Goal-directed" is fed back into the ARC solver backbone.
4. There are two possible outcomes: "Pass *I<sub>T</sub>*" (looping back to the beginning) or "fail on *I<sub>T</sub>*". The "fail" path leads back to the ARC solver backbone.
5. This process is repeated three times, with each iteration labeled *I<sub>T</sub>*.
**(c) Objectness:**
The text states: "When we consider 4-connected black pixels (value 0) as components, the components in each input and output image are as follows:".
For Training Pair 1 input image:
* Component 1: Locations = [(0,0), (0,1)]
* Component 8: Locations = [(4, 14)]
**(d) Geometry and Topology:**
For Training Pair 1 input image:
* For component 1: Shape: horizontal line. Different/Identical: Component 1 is different from ALL OTHERS!
* Component 1 is not touching with Component 2. Component 1 is at top-left of Component 2, and Component 2 is at bottom-right of Component 1.
**(e) Numbers and Counting:**
For Training Pair 1 input image:
* component 5, with the maximum size 10.
* component 8, with the minimum size 1.
* There are two components, 4 and 6, each of size 7, which appear most frequently (twice).
### Key Observations
* The ARC example demonstrates a visual reasoning task requiring pattern recognition.
* The KAAR augmentation process appears to iteratively refine the solution through multiple stages of analysis (objectness, geometry, numbers).
* The textual descriptions provide specific details about component identification, shape, relationships, and sizes within a training image.
* The augmentation process includes a feedback loop, suggesting an iterative refinement strategy.
* The component descriptions are specific to "Training Pair 1", implying that the analysis is being performed on a dataset of training examples.
### Interpretation
The image illustrates a system for solving visual reasoning problems, likely using a combination of automated analysis and iterative refinement. The KAAR augmentation process seems designed to improve the robustness of the ARC solver by systematically exploring different aspects of the visual input. The detailed component descriptions suggest that the system breaks down the image into fundamental elements and analyzes their properties to identify patterns and relationships. The iterative nature of the augmentation process, with its feedback loop, indicates a learning or optimization strategy. The specific details about component sizes and frequencies suggest that the system is capable of quantifying visual features and using them to make inferences. The mention of "Training Pair 1" suggests that this is part of a larger machine learning pipeline. The system appears to be designed to learn from examples and improve its ability to solve visual reasoning problems over time.