## Line Graph: ΔP vs Layer for Qwen3-8B and Qwen3-32B Models
### Overview
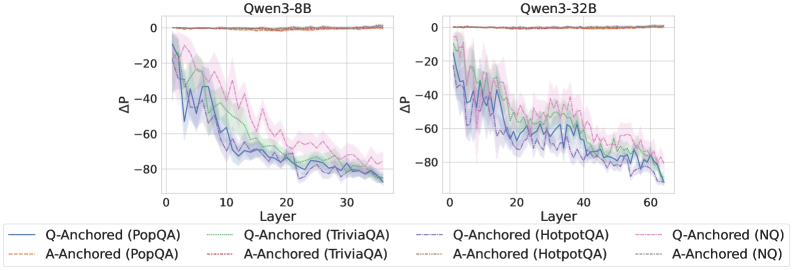
The image contains two side-by-side line graphs comparing the performance of Q-Anchored and A-Anchored methods across different datasets (PopQA, TriviaQA, HotpotQA, NQ) for two versions of the Qwen3 model (8B and 32B parameters). The y-axis represents ΔP (change in performance), and the x-axis represents model layers. Each graph shows multiple colored lines with shaded confidence intervals.
### Components/Axes
- **Left Chart**: Qwen3-8B model
- **Right Chart**: Qwen3-32B model
- **Y-Axis**: ΔP (range: -80 to 0)
- **X-Axis**: Layer (0 to 30 for 8B, 0 to 60 for 32B)
- **Legend**: Located at the bottom, with six entries:
- Solid blue: Q-Anchored (PopQA)
- Dashed green: Q-Anchored (TriviaQA)
- Dotted red: Q-Anchored (HotpotQA)
- Solid orange: A-Anchored (PopQA)
- Dashed purple: A-Anchored (TriviaQA)
- Dotted pink: A-Anchored (HotpotQA)
- Solid gray: A-Anchored (NQ)
- Dashed gray: Q-Anchored (NQ)
### Detailed Analysis
#### Qwen3-8B Chart
- **Q-Anchored Lines**:
- PopQA (solid blue): Starts at 0, declines sharply to ~-80 by layer 30 with oscillations.
- TriviaQA (dashed green): Similar trend to PopQA but less steep (-60 to -70 by layer 30).
- HotpotQA (dotted red): Gradual decline to ~-60 by layer 30.
- NQ (dashed gray): Sharpest drop to ~-90 by layer 30.
- **A-Anchored Lines**:
- PopQA (solid orange): Remains near 0 throughout.
- TriviaQA (dashed purple): Slight decline to ~-10 by layer 30.
- HotpotQA (dotted pink): Minimal change (~-5 by layer 30).
- NQ (solid gray): Stable near 0.
#### Qwen3-32B Chart
- **Q-Anchored Lines**:
- PopQA (solid blue): Starts at 0, drops to ~-80 by layer 60 with volatility.
- TriviaQA (dashed green): Declines to ~-70 by layer 60.
- HotpotQA (dotted red): Gradual decline to ~-60 by layer 60.
- NQ (dashed gray): Sharp drop to ~-90 by layer 60.
- **A-Anchored Lines**:
- PopQA (solid orange): Stable near 0.
- TriviaQA (dashed purple): Slight decline to ~-10 by layer 60.
- HotpotQA (dotted pink): Minimal change (~-5 by layer 60).
- NQ (solid gray): Stable near 0.
### Key Observations
1. **Q-Anchored vs A-Anchored**: Q-Anchored methods show significant ΔP degradation across layers, while A-Anchored methods remain stable.
2. **Model Size Impact**: The 32B model exhibits more pronounced ΔP declines for Q-Anchored methods compared to the 8B model.
3. **Dataset Sensitivity**: NQ dataset shows the steepest ΔP decline for Q-Anchored methods in both models.
4. **Confidence Intervals**: Shaded regions indicate variability, with Q-Anchored methods showing wider intervals in deeper layers.
### Interpretation
The data suggests that Q-Anchored methods are more sensitive to layer depth, with performance degradation (ΔP) increasing as layers progress. This trend is amplified in the larger 32B model, indicating potential scalability challenges. A-Anchored methods maintain stability, implying robustness to layer depth variations. The NQ dataset consistently drives the largest ΔP declines, highlighting its role as a critical factor in performance degradation. The results may reflect architectural differences in how anchoring strategies interact with model scale and dataset complexity.