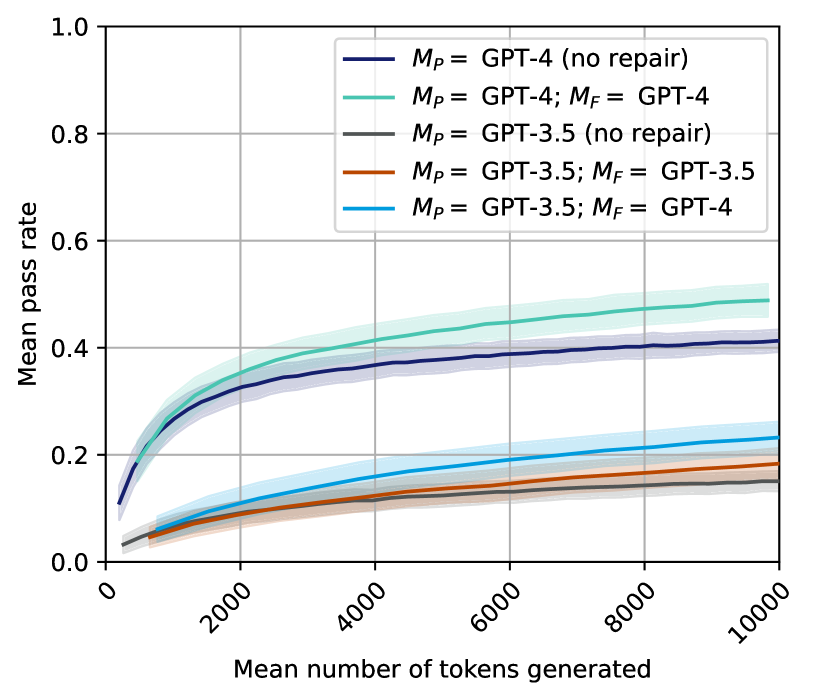
## Line Chart: Mean Pass Rate vs. Mean Number of Tokens Generated
### Overview
The image is a line chart comparing the mean pass rate against the mean number of tokens generated for different GPT models. The chart displays five different configurations of GPT models, each represented by a distinct colored line with a shaded area indicating uncertainty. The x-axis represents the mean number of tokens generated, ranging from 0 to 10000. The y-axis represents the mean pass rate, ranging from 0.0 to 1.0.
### Components/Axes
* **X-axis:** Mean number of tokens generated, with tick marks at 0, 2000, 4000, 6000, 8000, and 10000.
* **Y-axis:** Mean pass rate, with tick marks at 0.0, 0.2, 0.4, 0.6, 0.8, and 1.0.
* **Legend:** Located in the top-right corner, the legend identifies each line by the GPT model configuration.
* Dark Blue: *M<sub>P</sub>* = GPT-4 (no repair)
* Light Green: *M<sub>P</sub>* = GPT-4; *M<sub>F</sub>* = GPT-4
* Gray: *M<sub>P</sub>* = GPT-3.5 (no repair)
* Brown: *M<sub>P</sub>* = GPT-3.5; *M<sub>F</sub>* = GPT-3.5
* Teal: *M<sub>P</sub>* = GPT-3.5; *M<sub>F</sub>* = GPT-4
### Detailed Analysis
* **Dark Blue Line: *M<sub>P</sub>* = GPT-4 (no repair)**
* Trend: The line starts at approximately 0.1 at 0 tokens and increases rapidly, then plateaus around 0.38 at approximately 4000 tokens, remaining relatively flat until 10000 tokens.
* Data Points: (0, 0.1), (2000, 0.3), (4000, 0.38), (10000, 0.4)
* **Light Green Line: *M<sub>P</sub>* = GPT-4; *M<sub>F</sub>* = GPT-4**
* Trend: The line starts at approximately 0.15 at 0 tokens and increases rapidly, then plateaus around 0.45 at approximately 6000 tokens, remaining relatively flat until 10000 tokens.
* Data Points: (0, 0.15), (2000, 0.35), (6000, 0.45), (10000, 0.5)
* **Gray Line: *M<sub>P</sub>* = GPT-3.5 (no repair)**
* Trend: The line starts at approximately 0.04 at 0 tokens and increases gradually, reaching approximately 0.15 at 10000 tokens.
* Data Points: (0, 0.04), (2000, 0.08), (6000, 0.12), (10000, 0.15)
* **Brown Line: *M<sub>P</sub>* = GPT-3.5; *M<sub>F</sub>* = GPT-3.5**
* Trend: The line starts at approximately 0.05 at 0 tokens and increases gradually, reaching approximately 0.18 at 10000 tokens.
* Data Points: (0, 0.05), (2000, 0.1), (6000, 0.15), (10000, 0.18)
* **Teal Line: *M<sub>P</sub>* = GPT-3.5; *M<sub>F</sub>* = GPT-4**
* Trend: The line starts at approximately 0.08 at 0 tokens and increases gradually, reaching approximately 0.2 at 10000 tokens.
* Data Points: (0, 0.08), (2000, 0.12), (6000, 0.17), (10000, 0.2)
### Key Observations
* The GPT-4 models (*M<sub>P</sub>* = GPT-4) consistently outperform the GPT-3.5 models in terms of mean pass rate.
* Using GPT-4 for both *M<sub>P</sub>* and *M<sub>F</sub>* yields the highest mean pass rate.
* The mean pass rate increases rapidly for all models initially, then plateaus as the number of tokens generated increases.
* The shaded areas around each line indicate the uncertainty or variability in the mean pass rate.
### Interpretation
The data suggests that GPT-4 models are more effective at generating passing outputs compared to GPT-3.5 models. Furthermore, using GPT-4 for both the primary model (*M<sub>P</sub>*) and the repair model (*M<sub>F</sub>*) results in the highest pass rate, indicating that the combination of a strong primary model and a strong repair model is beneficial. The initial rapid increase in pass rate followed by a plateau suggests that the models quickly learn to generate passing outputs, but there is a limit to how much the pass rate can be improved with additional tokens. The uncertainty, represented by the shaded areas, highlights the variability in the model's performance.