## Line Chart: Mean Pass Rate vs. Mean Number of Tokens Generated
### Overview
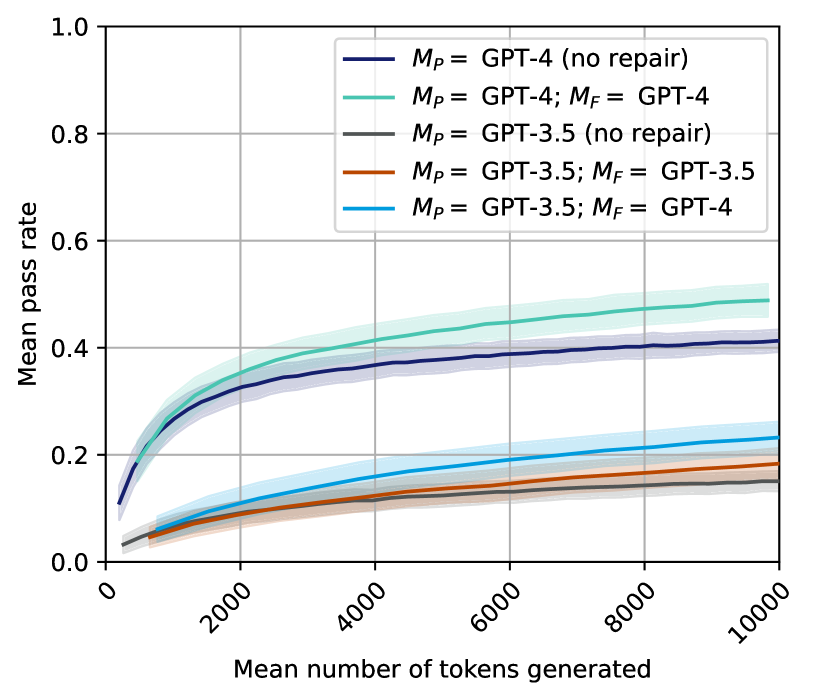
The image is a line chart displaying the relationship between the mean number of tokens generated (x-axis) and the mean pass rate (y-axis) for five different model configurations. The chart compares the performance of GPT-4 and GPT-3.5 models, both with and without a "repair" mechanism. Each line is accompanied by a shaded region representing a confidence interval or variability.
### Components/Axes
* **Chart Type:** Line chart with shaded confidence bands.
* **X-Axis:**
* **Label:** "Mean number of tokens generated"
* **Scale:** Linear scale from 0 to 10,000.
* **Major Ticks:** 0, 2000, 4000, 6000, 8000, 10000.
* **Y-Axis:**
* **Label:** "Mean pass rate"
* **Scale:** Linear scale from 0.0 to 1.0.
* **Major Ticks:** 0.0, 0.2, 0.4, 0.6, 0.8, 1.0.
* **Legend:** Located in the top-right quadrant of the chart area. It contains five entries, each with a colored line sample and a text label.
1. **Dark Blue Line:** `M_P = GPT-4 (no repair)`
2. **Teal Line:** `M_P = GPT-4; M_F = GPT-4`
3. **Gray Line:** `M_P = GPT-3.5 (no repair)`
4. **Orange Line:** `M_P = GPT-3.5; M_F = GPT-3.5`
5. **Light Blue Line:** `M_P = GPT-3.5; M_F = GPT-4`
* **Grid:** A light gray grid is present, aligned with the major ticks on both axes.
### Detailed Analysis
The chart plots five data series. All series show a logarithmic-like growth trend: a rapid initial increase in mean pass rate as the mean number of tokens generated increases, followed by a gradual flattening (diminishing returns).
**Trend Verification & Data Point Extraction (Approximate Values):**
1. **`M_P = GPT-4 (no repair)` (Dark Blue Line):**
* **Trend:** Starts low, rises steeply until ~2000 tokens, then continues to rise at a decreasing rate.
* **Approximate Points:** At 0 tokens: ~0.10. At 2000 tokens: ~0.32. At 10000 tokens: ~0.41.
2. **`M_P = GPT-4; M_F = GPT-4` (Teal Line):**
* **Trend:** Follows a similar shape to the dark blue line but is consistently higher. This is the top-performing series.
* **Approximate Points:** At 0 tokens: ~0.12. At 2000 tokens: ~0.35. At 10000 tokens: ~0.49.
3. **`M_P = GPT-3.5 (no repair)` (Gray Line):**
* **Trend:** The lowest-performing series. Shows a very shallow, almost linear increase.
* **Approximate Points:** At 0 tokens: ~0.03. At 2000 tokens: ~0.08. At 10000 tokens: ~0.15.
4. **`M_P = GPT-3.5; M_F = GPT-3.5` (Orange Line):**
* **Trend:** Performs better than the GPT-3.5 (no repair) baseline but worse than all GPT-4 configurations.
* **Approximate Points:** At 0 tokens: ~0.03. At 2000 tokens: ~0.09. At 10000 tokens: ~0.18.
5. **`M_P = GPT-3.5; M_F = GPT-4` (Light Blue Line):**
* **Trend:** The best-performing configuration using GPT-3.5 as the primary model (`M_P`). It shows a more pronounced upward curve than the other GPT-3.5 lines.
* **Approximate Points:** At 0 tokens: ~0.03. At 2000 tokens: ~0.11. At 10000 tokens: ~0.23.
**Spatial Grounding & Confidence Intervals:**
* The shaded bands around each line indicate uncertainty. The bands for the top two (GPT-4) lines are wider, suggesting greater variance in their performance.
* The legend is positioned in the top-right, overlapping the upper portion of the chart but not obscuring critical data trends.
### Key Observations
1. **Model Hierarchy:** There is a clear performance hierarchy: GPT-4 based configurations significantly outperform all GPT-3.5 based configurations across the entire range of token counts.
2. **Impact of Repair (`M_F`):** For both GPT-4 and GPT-3.5, adding a repair model (`M_F`) improves the mean pass rate compared to the "no repair" baseline. The improvement is more dramatic for GPT-4.
3. **Cross-Model Repair:** Using a stronger model for repair (`M_F = GPT-4`) provides a notable boost to the weaker primary model (`M_P = GPT-3.5`), lifting its performance curve above the `M_P = GPT-3.5; M_F = GPT-3.5` configuration.
4. **Diminishing Returns:** All curves exhibit diminishing returns; the gain in pass rate per additional token generated decreases as the total token count increases. The curves begin to plateau after approximately 4000-6000 tokens.
### Interpretation
This chart demonstrates the efficacy of a "repair" or refinement step (`M_F`) in improving the pass rate of generated code or text (implied by "pass rate" and "tokens generated"). The data suggests two key insights:
1. **Base Model Capability is Paramount:** The primary model (`M_P`) sets the fundamental performance ceiling. No amount of repair with GPT-3.5 can bring a GPT-3.5-based system to the level of a GPT-4 system, even one without repair.
2. **Repair is a Force Multiplier:** The repair mechanism acts as a multiplier on the base model's capability. It is most effective when applied to a strong base model (GPT-4 + GPT-4 repair yields the highest absolute performance). However, it can also be used strategically to elevate a weaker model's output, as seen by `M_P = GPT-3.5; M_F = GPT-4` outperforming `M_P = GPT-3.5; M_F = GPT-3.5`.
The chart implies that for tasks where generating more tokens (e.g., through iterative refinement or longer solutions) is acceptable, investing in both a strong base model and a strong repair model yields the best results. The plateauing curves also suggest there may be an optimal token budget beyond which further generation provides minimal quality improvement.