## Line Graph: Mean Pass Rate vs. Mean Number of Tokens Generated
### Overview
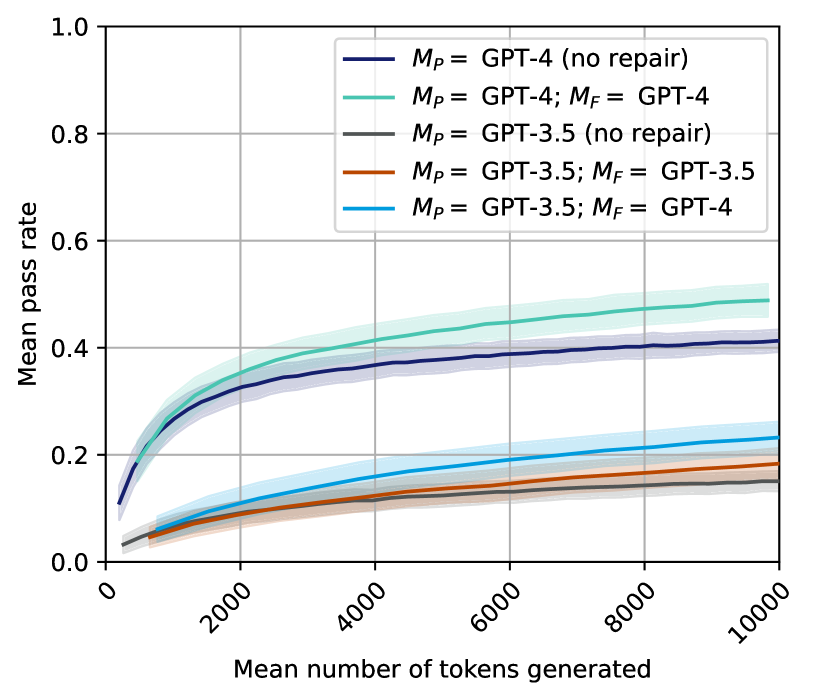
The graph compares the performance of different GPT model configurations (GPT-4 and GPT-3.5) across two scenarios: "no repair" and "with repair" (denoted as _M<sub>P</sub>_ and _M<sub>F</sub>_). Performance is measured as "Mean pass rate" against the "Mean number of tokens generated" (x-axis). Five data series are plotted, with shaded regions indicating uncertainty.
### Components/Axes
- **X-axis**: "Mean number of tokens generated" (0 to 10,000, logarithmic scale).
- **Y-axis**: "Mean pass rate" (0.0 to 1.0, linear scale).
- **Legend**: Located in the top-right corner, with five entries:
1. Dark blue: _M<sub>P</sub>_ = GPT-4 (no repair)
2. Teal: _M<sub>P</sub>_ = GPT-4; _M<sub>F</sub>_ = GPT-4 (repair)
3. Gray: _M<sub>P</sub>_ = GPT-3.5 (no repair)
4. Orange: _M<sub>P</sub>_ = GPT-3.5; _M<sub>F</sub>_ = GPT-3.5 (repair)
5. Light blue: _M<sub>P</sub>_ = GPT-3.5; _M<sub>F</sub>_ = GPT-4 (repair)
### Detailed Analysis
1. **Dark Blue Line (GPT-4, no repair)**:
- Starts at ~0.1 pass rate at 1,000 tokens.
- Rises steadily to ~0.4 pass rate at 10,000 tokens.
- Shaded region widens slightly, indicating moderate uncertainty.
2. **Teal Line (GPT-4 with repair)**:
- Begins at ~0.05 pass rate at 1,000 tokens.
- Reaches ~0.5 pass rate at 10,000 tokens.
- Shaded region is the widest, suggesting higher variability.
3. **Gray Line (GPT-3.5, no repair)**:
- Starts at ~0.02 pass rate at 1,000 tokens.
- Ends at ~0.15 pass rate at 10,000 tokens.
- Shaded region is narrow, indicating low uncertainty.
4. **Orange Line (GPT-3.5 with repair)**:
- Begins at ~0.01 pass rate at 1,000 tokens.
- Ends at ~0.18 pass rate at 10,000 tokens.
- Shaded region is moderately wide.
5. **Light Blue Line (GPT-3.5 with GPT-4 repair)**:
- Starts at ~0.03 pass rate at 1,000 tokens.
- Ends at ~0.22 pass rate at 10,000 tokens.
- Shaded region is the narrowest, indicating high confidence.
### Key Observations
- **GPT-4 superiority**: All GPT-4 configurations outperform GPT-3.5 variants, especially at higher token counts.
- **Repair impact**: Repair mechanisms improve pass rates for both models, with GPT-4 showing the largest gains.
- **Uncertainty patterns**: GPT-4 models exhibit wider shaded regions, suggesting greater variability in performance across trials.
- **Efficiency trade-off**: GPT-3.5 with GPT-4 repair achieves ~20% pass rate at 10,000 tokens but requires more tokens than GPT-4 alone.
### Interpretation
The data demonstrates that GPT-4 models consistently achieve higher pass rates than GPT-3.5, with repair mechanisms amplifying performance gains. The shaded regions imply that GPT-4's results are less predictable, possibly due to architectural complexity or training data differences. The light blue line (hybrid repair) suggests that combining GPT-3.5 with GPT-4 repair offers a cost-effective middle ground, though it underperforms pure GPT-4 configurations. These trends highlight the trade-offs between model size, repair strategies, and computational efficiency in NLP systems.