## Line Graphs: LLaMA-3-2B-Instruct and LLaMA-3-8B-Instruct Performance Comparison
### Overview
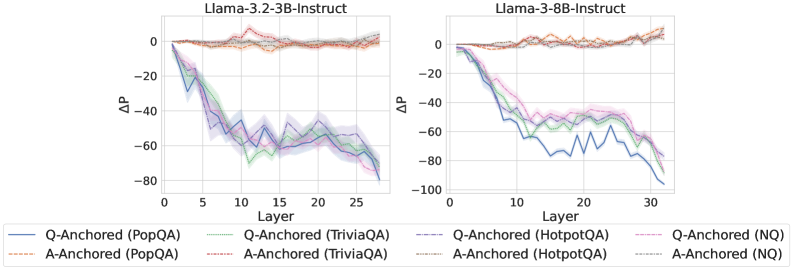
The image contains two side-by-side line graphs comparing the performance of different anchoring methods (Q-Anchored and A-Anchored) across datasets (PopQA, TriviaQA, HotpotQA, NQ) in LLaMA-3-2B-Instruct and LLaMA-3-8B-Instruct models. The y-axis represents ΔP (perplexity change), and the x-axis represents model layers. Each graph includes shaded regions indicating confidence intervals.
---
### Components/Axes
- **Left Graph (LLaMA-3-2B-Instruct)**:
- **X-axis**: Layer (0 to 25)
- **Y-axis**: ΔP (range: -100 to 0)
- **Legend**:
- Blue: Q-Anchored (PopQA)
- Green: Q-Anchored (TriviaQA)
- Red: Q-Anchored (HotpotQA)
- Purple: Q-Anchored (NQ)
- Dashed Orange: A-Anchored (PopQA)
- Dashed Green: A-Anchored (TriviaQA)
- Dashed Red: A-Anchored (HotpotQA)
- Dashed Purple: A-Anchored (NQ)
- **Right Graph (LLaMA-3-8B-Instruct)**:
- **X-axis**: Layer (0 to 30)
- **Y-axis**: ΔP (range: -100 to 0)
- **Legend**: Same as the left graph.
---
### Detailed Analysis
#### LLaMA-3-2B-Instruct (Left Graph)
1. **Q-Anchored (PopQA)** (Blue):
- Starts at 0 (layer 0), drops sharply to -60 by layer 25.
- Fluctuates between -40 and -60 in mid-layers (layers 5–15).
2. **Q-Anchored (TriviaQA)** (Green):
- Starts at 0, declines to -50 by layer 25.
- Shows moderate fluctuations (-30 to -50) in mid-layers.
3. **Q-Anchored (HotpotQA)** (Red):
- Starts at 0, drops to -40 by layer 25.
- Fluctuates between -20 and -40 in mid-layers.
4. **Q-Anchored (NQ)** (Purple):
- Starts at 0, declines to -70 by layer 25.
- Sharp drop to -70 in early layers (layers 5–10), then stabilizes.
5. **A-Anchored (PopQA)** (Dashed Orange):
- Starts at 0, ends at -20 by layer 25.
- Minimal fluctuations (-10 to -20).
6. **A-Anchored (TriviaQA)** (Dashed Green):
- Starts at 0, ends at -30 by layer 25.
- Slight dip to -25 in mid-layers.
7. **A-Anchored (HotpotQA)** (Dashed Red):
- Starts at 0, ends at -25 by layer 25.
- Stable with minor fluctuations (-15 to -25).
8. **A-Anchored (NQ)** (Dashed Purple):
- Starts at 0, ends at -40 by layer 25.
- Gradual decline with minor fluctuations (-20 to -40).
#### LLaMA-3-8B-Instruct (Right Graph)
1. **Q-Anchored (PopQA)** (Blue):
- Starts at 0, drops sharply to -100 by layer 30.
- Steep decline in early layers (layers 5–15), then stabilizes.
2. **Q-Anchored (TriviaQA)** (Green):
- Starts at 0, declines to -80 by layer 30.
- Sharp drop to -60 in early layers, then stabilizes.
3. **Q-Anchored (HotpotQA)** (Red):
- Starts at 0, drops to -60 by layer 30.
- Moderate decline (-40 to -60) in mid-layers.
4. **Q-Anchored (NQ)** (Purple):
- Starts at 0, drops to -90 by layer 30.
- Steep decline to -70 in early layers, then stabilizes.
5. **A-Anchored (PopQA)** (Dashed Orange):
- Starts at 0, ends at -40 by layer 30.
- Gradual decline (-20 to -40).
6. **A-Anchored (TriviaQA)** (Dashed Green):
- Starts at 0, ends at -50 by layer 30.
- Slight dip to -35 in mid-layers.
7. **A-Anchored (HotpotQA)** (Dashed Red):
- Starts at 0, ends at -35 by layer 30.
- Stable with minor fluctuations (-25 to -35).
8. **A-Anchored (NQ)** (Dashed Purple):
- Starts at 0, ends at -60 by layer 30.
- Gradual decline (-30 to -60).
---
### Key Observations
1. **Model Size Impact**:
- The 8B model shows steeper ΔP declines compared to the 2B model, especially for Q-Anchored methods.
- Example: Q-Anchored (NQ) in 8B drops to -90 vs. -70 in 2B.
2. **Anchoring Method Differences**:
- **Q-Anchored** methods exhibit larger ΔP drops, particularly for NQ and HotpotQA datasets.
- **A-Anchored** methods show smaller, more stable ΔP values across layers.
3. **Dataset Variability**:
- NQ consistently shows the largest ΔP drops, suggesting it is the most challenging dataset.
- PopQA and TriviaQA have moderate ΔP declines, while HotpotQA has the smallest drops.
4. **Confidence Intervals**:
- Shaded regions indicate variability in ΔP measurements. Larger models (8B) show wider confidence intervals, especially in Q-Anchored methods.
---
### Interpretation
- **Model Size and Performance**: The 8B model’s larger ΔP drops suggest that increased model size amplifies the impact of anchoring methods, particularly for complex datasets like NQ.
- **Anchoring Robustness**: A-Anchored methods demonstrate greater stability, implying they may be more effective in maintaining performance across layers.
- **Dataset Sensitivity**: NQ’s poor performance across both models highlights its inherent difficulty, possibly due to its reliance on reasoning or knowledge-intensive tasks.
- **Layer-Specific Trends**: Early layers (0–10) show the most significant ΔP changes, indicating that anchoring methods have a stronger effect in initial processing stages.
This analysis underscores the importance of anchoring strategies in model performance, with A-Anchored methods offering potential advantages in stability and robustness.