## Line Charts: Llama-3.2 Model Layer-wise ΔP Analysis
### Overview
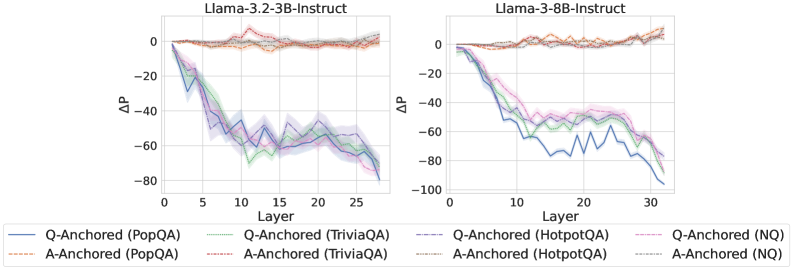
The image displays two side-by-side line charts comparing the layer-wise change in probability (ΔP) for two different-sized language models from the Llama-3.2 series: a 3-billion parameter model (3B-Instruct) on the left and an 8-billion parameter model (8B-Instruct) on the right. Each chart plots the ΔP metric across the model's layers for four different question-answering datasets, using two distinct anchoring methods (Q-Anchored and A-Anchored).
### Components/Axes
* **Titles:**
* Left Chart: `Llama-3.2-3B-Instruct`
* Right Chart: `Llama-3.2-8B-Instruct`
* **Axes:**
* **X-axis (Both Charts):** Labeled `Layer`. The scale runs from 0 to approximately 30, with major tick marks at 0, 5, 10, 15, 20, 25, and 30.
* **Y-axis (Both Charts):** Labeled `ΔP`. The scale runs from -100 to 0, with major tick marks at -100, -80, -60, -40, -20, and 0.
* **Legend (Bottom, spanning both charts):** Contains 8 entries, differentiating lines by color, line style (solid vs. dashed), and dataset.
* **Solid Lines (Q-Anchored):**
* Blue: `Q-Anchored (PopQA)`
* Green: `Q-Anchored (TriviaQA)`
* Purple: `Q-Anchored (HotpotQA)`
* Pink: `Q-Anchored (NQ)`
* **Dashed Lines (A-Anchored):**
* Orange: `A-Anchored (PopQA)`
* Red: `A-Anchored (TriviaQA)`
* Brown: `A-Anchored (HotpotQA)`
* Gray: `A-Anchored (NQ)`
* **Visual Elements:** Each data series is represented by a colored line with a semi-transparent shaded region around it, likely indicating confidence intervals or standard deviation.
### Detailed Analysis
**Left Chart: Llama-3.2-3B-Instruct**
* **Q-Anchored Series (Solid Lines):** All four datasets show a strong, consistent downward trend. ΔP starts near 0 at Layer 0 and decreases sharply, reaching values between approximately -60 and -80 by Layer 27. The lines are tightly clustered, with the blue (PopQA) and purple (HotpotQA) lines often at the lower end of the range.
* **A-Anchored Series (Dashed Lines):** All four datasets show a flat, stable trend. ΔP remains very close to 0 across all layers, with minor fluctuations. The lines are tightly clustered near the top of the chart.
**Right Chart: Llama-3.2-8B-Instruct**
* **Q-Anchored Series (Solid Lines):** The downward trend is present but more varied compared to the 3B model. The blue line (PopQA) shows the steepest and most volatile decline, dropping to near -100 around Layer 20 before a slight recovery. The green (TriviaQA), purple (HotpotQA), and pink (NQ) lines follow a smoother downward path, ending between -60 and -80 by Layer 32.
* **A-Anchored Series (Dashed Lines):** Similar to the 3B model, these series remain stable and close to 0 across all layers, with minimal fluctuation.
### Key Observations
1. **Anchoring Method Dominance:** The most striking pattern is the drastic difference between Q-Anchored and A-Anchored methods. Q-Anchoring leads to a significant negative ΔP that grows with layer depth, while A-Anchoring maintains a ΔP near zero.
2. **Model Size Effect:** The 8B model exhibits more pronounced volatility in the Q-Anchored PopQA series (blue line) compared to the 3B model. The other Q-Anchored series in the 8B model also show slightly more separation from each other.
3. **Dataset Similarity:** Within each anchoring method, the trends across the four datasets (PopQA, TriviaQA, HotpotQA, NQ) are broadly similar, suggesting the anchoring technique is a stronger factor than the specific dataset in determining the ΔP trajectory.
4. **Layer Dependence:** For Q-Anchored methods, the effect (negative ΔP) is not uniform; it intensifies progressively through the network layers.
### Interpretation
The data demonstrates a fundamental difference in how information is processed or retained within the model layers depending on the anchoring technique. "ΔP" likely represents a change in probability or confidence. The results suggest:
* **Q-Anchored (Question-Anchored) processing** causes a progressive and significant decrease in the measured probability metric as information flows deeper into the network. This could indicate a process of evidence accumulation, refinement, or a shift in focus away from the initial question's framing as the model generates an answer.
* **A-Anchored (Answer-Anchored) processing** maintains a stable probability metric throughout the layers. This implies that when anchored to the answer, the model's internal state regarding this metric does not change significantly from input to output, suggesting a more consistent or fixed processing pathway.
* The increased volatility in the larger 8B model's Q-Anchored PopQA series might reflect greater model capacity leading to more complex or non-linear internal transformations for that specific dataset.
In essence, the charts reveal that the choice of anchoring (question vs. answer) fundamentally alters the layer-wise dynamics of the model's internal probability landscape, with the question-anchored approach inducing a strong, depth-dependent decay effect.