## Line Charts: Llama-3 Model "I-Don't-Know Rate" Across Layers
### Overview
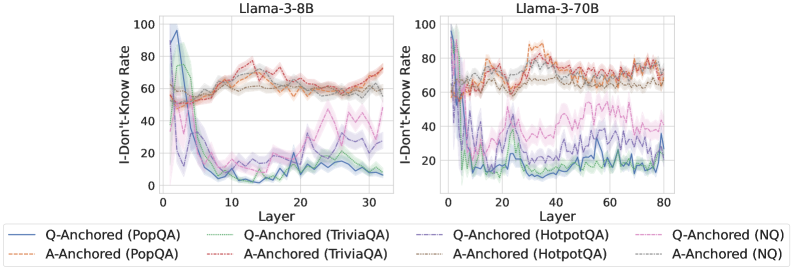
The image displays two side-by-side line charts comparing the "I-Don't-Know Rate" across the layers of two large language models: Llama-3-8B (left chart) and Llama-3-70B (right chart). Each chart plots multiple data series representing different question-answering datasets (PopQA, TriviaQA, HotpotQA, NQ) under two experimental conditions: "Q-Anchored" and "A-Anchored". The charts illustrate how the models' propensity to output "I don't know" changes as information propagates through the network's layers.
### Components/Axes
* **Chart Titles:**
* Left Chart: `Llama-3-8B`
* Right Chart: `Llama-3-70B`
* **Y-Axis (Both Charts):** Label is `I-Don't-Know Rate`. Scale runs from 0 to 100 in increments of 20.
* **X-Axis (Both Charts):** Label is `Layer`.
* For Llama-3-8B, the scale runs from 0 to 30.
* For Llama-3-70B, the scale runs from 0 to 80.
* **Legend (Bottom, spanning both charts):** Contains 8 entries, differentiating series by color and line style (solid vs. dashed).
* **Solid Lines (Q-Anchored):**
* Blue: `Q-Anchored (PopQA)`
* Green: `Q-Anchored (TriviaQA)`
* Purple: `Q-Anchored (HotpotQA)`
* Pink: `Q-Anchored (NQ)`
* **Dashed Lines (A-Anchored):**
* Orange: `A-Anchored (PopQA)`
* Red: `A-Anchored (TriviaQA)`
* Brown: `A-Anchored (HotpotQA)`
* Gray: `A-Anchored (NQ)`
### Detailed Analysis
**Llama-3-8B Chart (Left):**
* **Q-Anchored Series (Solid Lines):** All four solid lines show a similar, dramatic trend. They start at a very high rate (between ~80-100) at Layer 0, then plummet sharply within the first 5-10 layers to a low point (between ~0-20). After this initial drop, they exhibit a gradual, fluctuating upward trend through the remaining layers, ending between approximately 10-40 at Layer 30.
* *Trend Verification:* Steep initial decline followed by a slow, noisy recovery.
* **A-Anchored Series (Dashed Lines):** These lines follow a distinctly different pattern. They start at a moderate level (between ~40-60) at Layer 0. They show a general, fluctuating upward trend throughout all layers, ending at a higher rate (between ~60-75) at Layer 30. They do not exhibit the sharp initial drop seen in the Q-Anchored lines.
* *Trend Verification:* General upward drift with significant layer-to-layer fluctuation.
* **Spatial Grounding:** The Q-Anchored (solid) lines are consistently below the A-Anchored (dashed) lines from approximately Layer 5 onward. The highest final value belongs to the red dashed line (A-Anchored, TriviaQA).
**Llama-3-70B Chart (Right):**
* **Q-Anchored Series (Solid Lines):** Similar to the 8B model, these lines start high (near 100) and drop sharply in the early layers (0-10). However, the subsequent behavior is more volatile. They fluctuate significantly, with some series (notably blue - PopQA) showing a pronounced secondary dip around Layer 40 before rising again. Final values at Layer 80 are generally low, clustered between ~10-30.
* *Trend Verification:* Sharp initial drop, followed by high volatility and a general low plateau.
* **A-Anchored Series (Dashed Lines):** These lines start at a moderate-to-high level (~60-80). They exhibit a strong, fluctuating upward trend, peaking around Layers 30-50 (with some values exceeding 80), before slightly declining or stabilizing towards Layer 80. Final values remain high, between ~60-80.
* *Trend Verification:* Strong rise to a mid-network peak, followed by a slight decline or plateau.
* **Spatial Grounding:** The separation between Q-Anchored (solid, lower) and A-Anchored (dashed, higher) groups is even more pronounced and consistent across most layers compared to the 8B model. The orange dashed line (A-Anchored, PopQA) appears to be among the highest for much of the chart.
### Key Observations
1. **Fundamental Dichotomy:** There is a clear and consistent separation between the behavior of Q-Anchored (solid lines) and A-Anchored (dashed lines) conditions across both models. Q-Anchored leads to a low "I-Don't-Know Rate" after early layers, while A-Anchored maintains a high rate.
2. **Model Size Effect:** The larger Llama-3-70B model shows more pronounced volatility in its Q-Anchored rates and a more defined peak in its A-Anchored rates compared to the 8B model. The layer scale is also more than double.
3. **Early-Layer Criticality:** The most dramatic change for Q-Anchored series occurs in the first ~10 layers, suggesting this is where the model's internal "confidence" or answer formulation is most actively determined.
4. **Dataset Variation:** While the overall trends are consistent per anchoring method, there is notable variation between datasets (different colors). For example, in the 70B model, the blue Q-Anchored (PopQA) line shows a unique secondary dip.
### Interpretation
The data suggests a fundamental difference in how the model processes information based on the anchoring method. **Q-Anchoring** (likely conditioning on the question) appears to drive the model toward committing to an answer (or a "know" state) very early in its processing stream, resulting in a low "I-Don't-Know Rate" for the majority of the network. The subsequent slow rise may indicate a gradual reintroduction of uncertainty or a refinement process.
In contrast, **A-Anchoring** (likely conditioning on a potential answer) seems to keep the model in a more evaluative or uncertain state throughout its processing. The high and even increasing "I-Don't-Know Rate" suggests the model is constantly weighing the anchored answer against its internal knowledge, leading to higher expressed uncertainty. The peak in the middle layers of the 70B model could represent a point of maximal information integration or conflict resolution.
The stark contrast between the two conditions implies that the model's internal representation of "knowing" vs. "not knowing" is highly sensitive to the initial framing or prompt structure. This has significant implications for understanding model confidence and for designing prompts that elicit more calibrated expressions of uncertainty. The increased volatility in the larger model may reflect a more complex and nuanced internal deliberation process.