## Line Chart: I-Don't-Know Rate Across Llama-3 Models and Datasets
### Overview
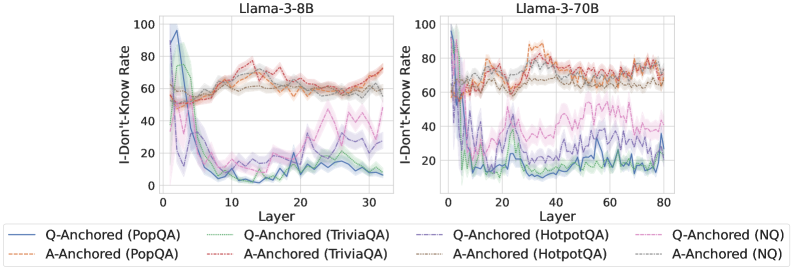
The image presents two line charts comparing the "I-Don't-Know Rate" (percentage of instances where a model responds with "I don't know") across different layers of the Llama-3-8B and Llama-3-70B models. The data is segmented by dataset (PopQA, TriviaQA, HotpotQA, NQ) and anchoring type (Q-Anchored vs. A-Anchored). The charts visualize how the I-Don't-Know rate varies with model layers and dataset-specific characteristics.
---
### Components/Axes
- **X-Axis (Layer)**:
- Llama-3-8B: 0 to 30 (in increments of 10)
- Llama-3-70B: 0 to 80 (in increments of 20)
- **Y-Axis (I-Don't-Know Rate)**: 0 to 100 (percentage)
- **Legend**:
- **Q-Anchored (PopQA)**: Blue solid line
- **Q-Anchored (TriviaQA)**: Green solid line
- **Q-Anchored (HotpotQA)**: Purple solid line
- **Q-Anchored (NQ)**: Pink solid line
- **A-Anchored (PopQA)**: Blue dashed line
- **A-Anchored (TriviaQA)**: Green dashed line
- **A-Anchored (HotpotQA)**: Purple dashed line
- **A-Anchored (NQ)**: Pink dashed line
- **Chart Titles**:
- Left: "Llama-3-8B"
- Right: "Llama-3-70B"
---
### Detailed Analysis
#### Llama-3-8B (Left Chart)
- **PopQA (Blue Solid)**:
- Starts at ~80% in layer 0, drops sharply to ~20% by layer 10, then fluctuates between 10–30%.
- **TriviaQA (Green Solid)**:
- Begins at ~60%, dips to ~10% by layer 10, then rises to ~40% by layer 30.
- **HotpotQA (Purple Solid)**:
- Peaks at ~90% in layer 0, drops to ~30% by layer 10, then stabilizes around 20–40%.
- **NQ (Pink Solid)**:
- Starts at ~70%, declines to ~20% by layer 10, then oscillates between 10–30%.
#### Llama-3-70B (Right Chart)
- **PopQA (Blue Solid)**:
- Begins at ~85%, drops to ~25% by layer 20, then fluctuates between 10–40%.
- **TriviaQA (Green Solid)**:
- Starts at ~65%, dips to ~15% by layer 20, then rises to ~50% by layer 60.
- **HotpotQA (Purple Solid)**:
- Peaks at ~95% in layer 0, drops to ~35% by layer 20, then stabilizes around 20–50%.
- **NQ (Pink Solid)**:
- Begins at ~75%, declines to ~25% by layer 20, then oscillates between 10–40%.
---
### Key Observations
1. **Model Size Impact**:
- Llama-3-70B shows more stable I-Don't-Know rates across layers compared to Llama-3-8B, suggesting larger models may handle uncertainty more consistently.
2. **Dataset Variability**:
- **HotpotQA** consistently exhibits the highest I-Don't-Know rates (up to 95% in layer 0), indicating it is the most challenging dataset.
- **NQ** shows the most erratic fluctuations, with sharp drops and rises across layers.
3. **Anchoring Type**:
- Q-Anchored (solid lines) and A-Anchored (dashed lines) trends are visually similar, but Q-Anchored lines often start higher in layer 0.
4. **Layer-Specific Trends**:
- Early layers (0–10) show the highest I-Don't-Know rates, with a general decline as layers increase, though some datasets (e.g., TriviaQA) exhibit late-layer spikes.
---
### Interpretation
The data suggests that:
- **Model Size**: Larger models (Llama-3-70B) demonstrate more stable I-Don't-Know rates, possibly due to better generalization or reduced uncertainty in deeper layers.
- **Dataset Complexity**: HotpotQA's high initial rates imply it tests the model's ability to handle complex, multi-step reasoning, while NQ's volatility may reflect its reliance on ambiguous or context-dependent queries.
- **Anchoring Methods**: The lack of significant divergence between Q-Anchored and A-Anchored lines suggests that anchoring type has minimal impact on the I-Don't-Know rate, though Q-Anchored lines may reflect initial confidence biases.
Notable anomalies include the sharp drop in HotpotQA's I-Don't-Know rate after layer 10, which could indicate a shift in model behavior or dataset-specific thresholds. The persistent fluctuations in NQ highlight its sensitivity to layer-specific model dynamics.