## Bar Chart: Event Composition By Cascade Size
### Overview
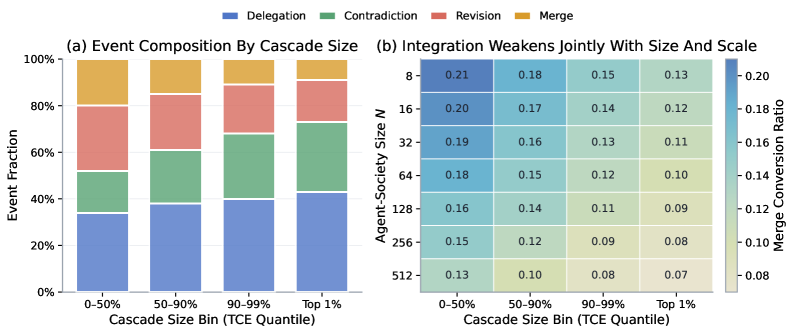
A stacked bar chart showing the proportion of four event types (Delegation, Contradiction, Revision, Merge) across four cascade size bins (0-50%, 50-90%, 90-99%, Top 1%).
### Components/Axes
- **X-axis**: Cascade Size Bin (TCQ Quantile) with categories:
- 0-50%
- 50-90%
- 90-99%
- Top 1%
- **Y-axis**: Event Fraction (0% to 100%)
- **Legend**:
- Delegation (blue)
- Contradiction (green)
- Revision (red)
- Merge (yellow)
### Detailed Analysis
- **0-50% Bin**:
- Delegation: ~35% (blue)
- Contradiction: ~20% (green)
- Revision: ~25% (red)
- Merge: ~20% (yellow)
- **50-90% Bin**:
- Delegation: ~40% (blue)
- Contradiction: ~25% (green)
- Revision: ~20% (red)
- Merge: ~15% (yellow)
- **90-99% Bin**:
- Delegation: ~45% (blue)
- Contradiction: ~30% (green)
- Revision: ~15% (red)
- Merge: ~10% (yellow)
- **Top 1% Bin**:
- Delegation: ~50% (blue)
- Contradiction: ~35% (green)
- Revision: ~10% (red)
- Merge: ~5% (yellow)
### Key Observations
- Delegation dominates smaller cascade bins (0-50%) and decreases as cascade size shrinks.
- Merge events are most frequent in the 0-50% bin (~20%) and drop sharply in smaller cascades.
- Contradiction increases slightly in smaller cascades (e.g., ~20% in 0-50% vs. ~35% in Top 1%).
## Heatmap: Integration Weakens Jointly With Size And Scale
### Overview
A heatmap showing merge conversion ratios across agent-society sizes (N) and cascade size bins (0-50%, 50-90%, 90-99%, Top 1%).
### Components/Axes
- **X-axis**: Cascade Size Bin (TCQ Quantile) with categories:
- 0-50%
- 50-90%
- 90-99%
- Top 1%
- **Y-axis**: Agent-Society Size (N) with values:
- 8
- 16
- 32
- 64
- 128
- 256
- 512
- **Color Scale**: Merge Conversion Ratio (0.08 to 0.21, darker blue = higher values)
### Detailed Analysis
- **Cascade Size Bin: 0-50%**
- N=8: 0.21
- N=16: 0.20
- N=32: 0.19
- N=64: 0.18
- N=128: 0.16
- N=256: 0.15
- N=512: 0.13
- **Cascade Size Bin: 50-90%**
- N=8: 0.18
- N=16: 0.17
- N=32: 0.16
- N=64: 0.15
- N=128: 0.14
- N=256: 0.12
- N=512: 0.10
- **Cascade Size Bin: 90-99%**
- N=8: 0.15
- N=16: 0.14
- N=32: 0.13
- N=64: 0.12
- N=128: 0.11
- N=256: 0.09
- N=512: 0.08
- **Cascade Size Bin: Top 1%**
- N=8: 0.13
- N=16: 0.12
- N=32: 0.11
- N=64: 0.10
- N=128: 0.09
- N=256: 0.08
- N=512: 0.07
### Key Observations
- Merge conversion ratios decrease as both cascade size and agent-society size increase.
- Largest cascades (Top 1%) have the lowest merge ratios (~0.07 at N=512).
- Smaller cascades (0-50%) show higher merge ratios (~0.21 at N=8).
## Interpretation
1. **Bar Chart Insights**:
- Delegation becomes more prevalent in smaller cascades, suggesting it is a primary mechanism for information spread in less impactful cascades.
- Merge events dominate larger cascades but diminish in the smallest cascades, implying merging is less critical for low-impact cascades.
2. **Heatmap Insights**:
- Integration (via merging) weakens as both cascade and agent-society sizes grow. This suggests larger systems struggle to maintain cohesive integration, possibly due to complexity or fragmentation.
- The steepest decline in merge ratios occurs in the Top 1% cascade bin, highlighting a critical threshold where integration becomes ineffective.
3. **Cross-Chart Relationships**:
- The bar chart’s decline in Merge events aligns with the heatmap’s trend of lower merge ratios in smaller cascades.
- Both visualizations emphasize that cascade size and system scale are inversely correlated with effective integration.
4. **Anomalies**:
- Contradiction events increase in smaller cascades (e.g., ~35% in Top 1% vs. ~20% in 0-50%), suggesting smaller cascades may involve more conflicting interactions.
- The heatmap’s sharp drop in merge ratios for Top 1% cascades (e.g., 0.07 at N=512) indicates a potential tipping point for integration failure.