## Heatmap and Line Chart: GPU Utilization and Latency vs. Batch Size and Sequence Length
### Overview
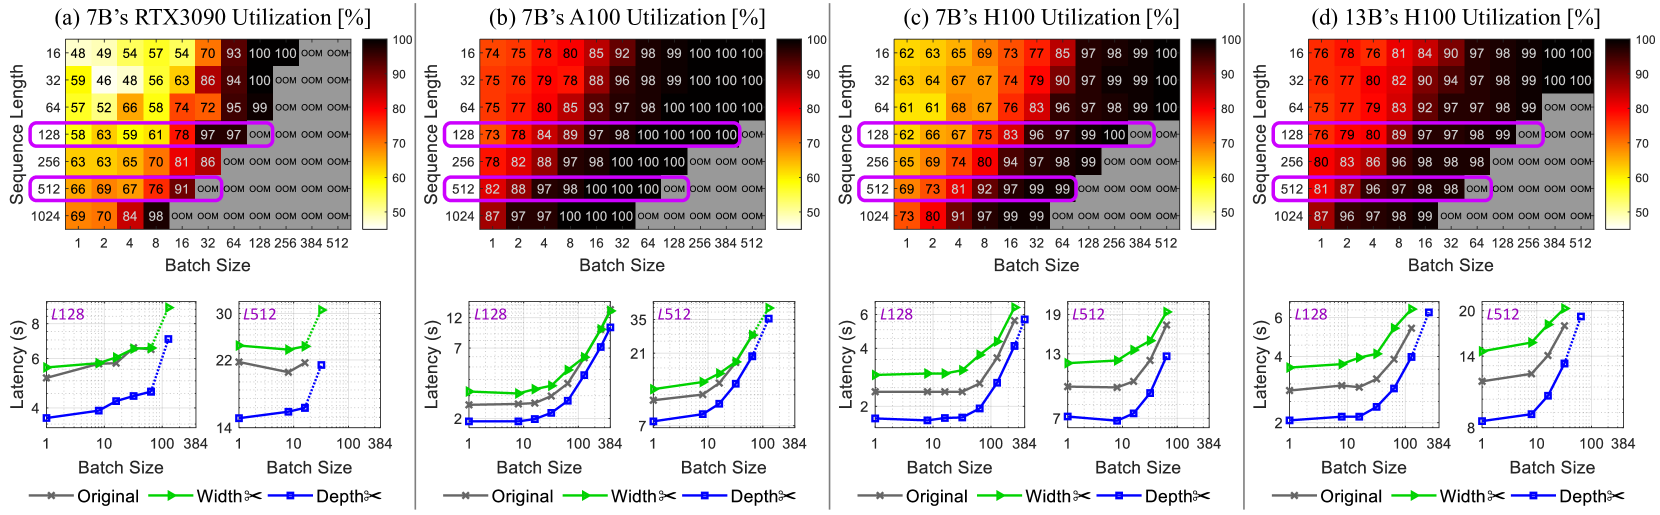
The image presents a comparative analysis of GPU utilization and latency across different GPU models (RTX3090, A100, H100) and sequence lengths, with varying batch sizes. The top row consists of heatmaps showing GPU utilization as a function of sequence length and batch size. The bottom row consists of line charts showing latency as a function of batch size for different sequence lengths and model configurations ("Original", "Width<", "Depth<").
### Components/Axes
**Heatmaps (Top Row):**
* **Titles:**
* (a) 7B's RTX3090 Utilization [%]
* (b) 7B's A100 Utilization [%]
* (c) 7B's H100 Utilization [%]
* (d) 13B's H100 Utilization [%]
* **Y-axis (Sequence Length):** 16, 32, 64, 128, 256, 512, 1024
* **X-axis (Batch Size):** 1, 2, 4, 8, 16, 32, 64, 128, 256, 384, 512
* **Color Scale:** Ranges from approximately 50% (yellow) to 100% (dark red).
* **"OOM"**: Indicates "Out Of Memory" errors.
**Line Charts (Bottom Row):**
* **Y-axis (Latency):** Latency (s), with varying scales for each plot.
* **X-axis (Batch Size):** 1, 10, 100, 384 (logarithmic scale)
* **Legends (Bottom):**
* Gray line with 'x' markers: Original
* Green line with triangle markers: Width<
* Blue dotted line with square markers: Depth<
* **Titles (Above each chart):** L128, L512 (indicating sequence length)
### Detailed Analysis
**Heatmaps:**
* **RTX3090 Utilization (a):**
* Utilization generally increases with both sequence length and batch size.
* "OOM" errors occur at higher sequence lengths and batch sizes.
* At sequence length 16, utilization ranges from 48% to 100%.
* At sequence length 1024, utilization ranges from 69% to 98% before hitting OOM.
* **A100 Utilization (b):**
* Higher utilization compared to RTX3090 across most configurations.
* "OOM" errors occur only at the highest sequence length (1024) and batch sizes.
* At sequence length 16, utilization ranges from 74% to 100%.
* At sequence length 1024, utilization ranges from 87% to 100% before hitting OOM.
* **H100 Utilization (c):**
* Generally high utilization, but lower than A100.
* "OOM" errors occur at sequence length 256 and higher, with batch sizes of 128 and higher.
* At sequence length 16, utilization ranges from 62% to 100%.
* At sequence length 1024, utilization ranges from 73% to 99% before hitting OOM.
* **H100 Utilization (13B) (d):**
* Generally high utilization, similar to H100 (7B).
* "OOM" errors occur at sequence length 128 and higher, with batch sizes of 64 and higher.
* At sequence length 16, utilization ranges from 76% to 100%.
* At sequence length 1024, utilization ranges from 87% to 99% before hitting OOM.
**Line Charts:**
* **L128 (Sequence Length 128):**
* **RTX3090:**
* Original (gray): Latency increases slightly with batch size, from ~5.5s to ~6s.
* Width< (green): Latency increases slightly with batch size, from ~5.5s to ~8.5s.
* Depth< (blue): Latency increases with batch size, from ~3.5s to ~7.5s.
* **A100:**
* Original (gray): Latency increases with batch size, from ~2s to ~4s.
* Width< (green): Latency increases with batch size, from ~2.5s to ~12s.
* Depth< (blue): Latency increases with batch size, from ~2s to ~12s.
* **H100:**
* Original (gray): Latency increases with batch size, from ~2s to ~2.5s.
* Width< (green): Latency increases with batch size, from ~3s to ~5s.
* Depth< (blue): Latency increases with batch size, from ~1.5s to ~5.5s.
* **H100 (13B):**
* Original (gray): Latency increases with batch size, from ~2s to ~3s.
* Width< (green): Latency increases with batch size, from ~4s to ~6s.
* Depth< (blue): Latency increases with batch size, from ~2s to ~5s.
* **L512 (Sequence Length 512):**
* **RTX3090:**
* Original (gray): Latency increases slightly with batch size, from ~22s to ~22s.
* Width< (green): Latency increases slightly with batch size, from ~22s to ~30s.
* Depth< (blue): Latency increases with batch size, from ~14s to ~22s.
* **A100:**
* Original (gray): Latency increases with batch size, from ~2s to ~4s.
* Width< (green): Latency increases with batch size, from ~2.5s to ~12s.
* Depth< (blue): Latency increases with batch size, from ~2s to ~12s.
* **H100:**
* Original (gray): Latency increases with batch size, from ~2s to ~2.5s.
* Width< (green): Latency increases with batch size, from ~3s to ~5s.
* Depth< (blue): Latency increases with batch size, from ~1.5s to ~5.5s.
* **H100 (13B):**
* Original (gray): Latency increases with batch size, from ~2s to ~3s.
* Width< (green): Latency increases with batch size, from ~4s to ~6s.
* Depth< (blue): Latency increases with batch size, from ~2s to ~5s.
### Key Observations
* A100 generally exhibits higher utilization compared to RTX3090 and H100.
* "OOM" errors are more prevalent with RTX3090, especially at higher sequence lengths and batch sizes.
* Latency generally increases with batch size for all configurations.
* The "Depth<" configuration often results in lower latency compared to "Original" and "Width<".
* Increasing sequence length increases latency.
### Interpretation
The data suggests that A100 is more efficient in terms of GPU utilization compared to RTX3090 and H100 for the given tasks. The RTX3090 is more prone to memory limitations, leading to "OOM" errors. The "Depth<" configuration appears to be more optimized for latency, potentially due to architectural differences or specific optimizations. The trade-off between batch size and latency is evident, as increasing batch size generally increases latency. The choice of GPU and configuration should be based on the specific requirements of the task, considering factors such as memory constraints, desired utilization, and acceptable latency. The 13B model on the H100 shows similar utilization patterns to the 7B model, but with potentially higher absolute utilization values at certain configurations.