## [Composite Performance Analysis]: GPU Utilization and Latency for LLMs
### Overview
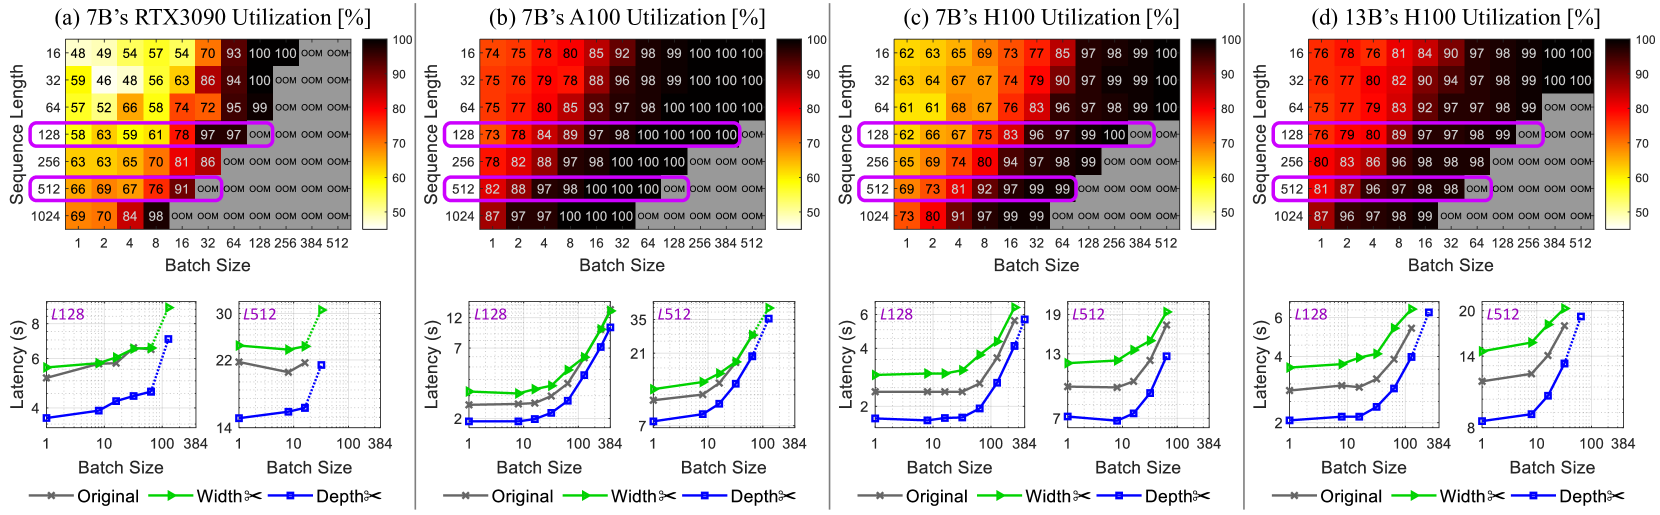
The image is a composite of four subplots (a–d) analyzing GPU utilization (heatmaps, top) and latency (line graphs, bottom) for large language models (LLMs) across different GPUs (RTX3090, A100, H100), model sizes (7B, 13B), batch sizes, and sequence lengths. Each subplot includes a heatmap (utilization %) and two line graphs (latency in seconds) for sequence lengths \( L128 \) and \( L512 \).
### Components/Axes
#### Heatmaps (Top of Each Subplot)
- **Axes**:
- *X-axis*: Batch Size (1, 2, 4, 8, 16, 32, 64, 128, 256, 384, 512).
- *Y-axis*: Sequence Length (16, 32, 64, 128, 256, 512, 1024).
- *Color Bar*: Utilization (%) (50 = yellow, 100 = red; “OOM” = Out of Memory, gray).
- **Subplot Titles**:
- (a) 7B’s RTX3090 Utilization [%]
- (b) 7B’s A100 Utilization [%]
- (c) 7B’s H100 Utilization [%]
- (d) 13B’s H100 Utilization [%]
#### Line Graphs (Bottom of Each Subplot)
- **Axes**:
- *X-axis*: Batch Size (1, 10, 100, 384) (logarithmic scale).
- *Y-axis*: Latency (s) (varies per subplot).
- **Legend**:
- Gray: Original model
- Green: Width×2 (model width scaled by 2)
- Blue: Depth×2 (model depth scaled by 2)
- **Subplot Titles (Line Graphs)**:
- Left: \( L128 \) (Sequence Length = 128)
- Right: \( L512 \) (Sequence Length = 512)
### Detailed Analysis
#### Subplot (a): 7B’s RTX3090 Utilization
- **Heatmap**:
- Utilization increases with batch size and sequence length, but “OOM” occurs at high batch sizes (e.g., batch 512, seq 1024).
- Key points: Seq 128, batch 128: 97% (purple box); Seq 512, batch 128: 91% (purple box).
- **Line Graphs**:
- \( L128 \): Latency rises with batch size (Original: ~4–8s; Width×2: ~5–9s; Depth×2: ~4–7s).
- \( L512 \): Latency is higher (Original: ~22–30s; Width×2: ~22–30s; Depth×2: ~14–22s).
#### Subplot (b): 7B’s A100 Utilization
- **Heatmap**:
- Higher utilization than RTX3090. Seq 128, batch 128: 100% (purple box); Seq 512, batch 128: 100% (purple box).
- “OOM” at high batch sizes (e.g., batch 512, seq 1024).
- **Line Graphs**:
- \( L128 \): Latency lower than RTX3090 (Original: ~2–12s; Width×2: ~2–12s; Depth×2: ~2–12s, steeper at batch 384).
- \( L512 \): Latency ~7–35s (all configurations, steeper at batch 384).
#### Subplot (c): 7B’s H100 Utilization
- **Heatmap**:
- Utilization similar to A100. Seq 128, batch 128: 100% (purple box); Seq 512, batch 128: 99% (purple box).
- “OOM” at high batch sizes.
- **Line Graphs**:
- \( L128 \): Latency ~2–6s (all configurations, steeper at batch 384).
- \( L512 \): Latency ~7–19s (all configurations, steeper at batch 384).
#### Subplot (d): 13B’s H100 Utilization
- **Heatmap**:
- Larger model (13B) on H100. Seq 128, batch 128: 99% (purple box); Seq 512, batch 128: 98% (purple box).
- “OOM” at high batch sizes.
- **Line Graphs**:
- \( L128 \): Latency ~2–6s (all configurations, steeper at batch 384).
- \( L512 \): Latency ~8–20s (all configurations, steeper at batch 384).
### Key Observations
1. **Utilization Trend**: GPU utilization increases with batch size and sequence length, but “OOM” occurs at high batch sizes (≥256) and sequence lengths (≥512).
2. **Latency Trend**: Latency rises with batch size, especially at larger sequence lengths (\( L512 > L128 \)). Width×2 and Depth×2 configurations have similar latency to the Original model.
3. **GPU Comparison**: A100 and H100 outperform RTX3090 in utilization for the 7B model. The 13B model on H100 has slightly lower utilization than the 7B model on H100.
4. **OOM Occurrence**: “OOM” is more frequent at high batch sizes (≥256) and sequence lengths (≥512) across all GPUs.
### Interpretation
- **Utilization vs. Batch/Sequence**: Higher batch sizes and sequence lengths maximize GPU utilization (up to 100%) but risk “OOM,” highlighting a trade-off between utilization and memory constraints.
- **Latency vs. Configuration**: Model scaling (Width×2, Depth×2) does not drastically increase latency, but batch size does. This suggests scaling model width/depth is feasible with manageable latency increases.
- **GPU Performance**: A100 and H100’s higher utilization (vs. RTX3090) for the 7B model reflects their superior memory and compute capabilities. The 13B model’s slightly lower utilization on H100 may stem from higher memory demands.
- **Practical Implications**: Balance batch size and sequence length to maximize utilization without “OOM.” Model scaling (Width×2, Depth×2) is viable for performance gains with minimal latency impact.
This analysis provides a comprehensive view of GPU utilization and latency trade-offs for LLMs, enabling informed decisions on hardware, model scaling, and batch/sequence length optimization.