## Heatmaps and Line Graphs: GPU Utilization and Latency Analysis
### Overview
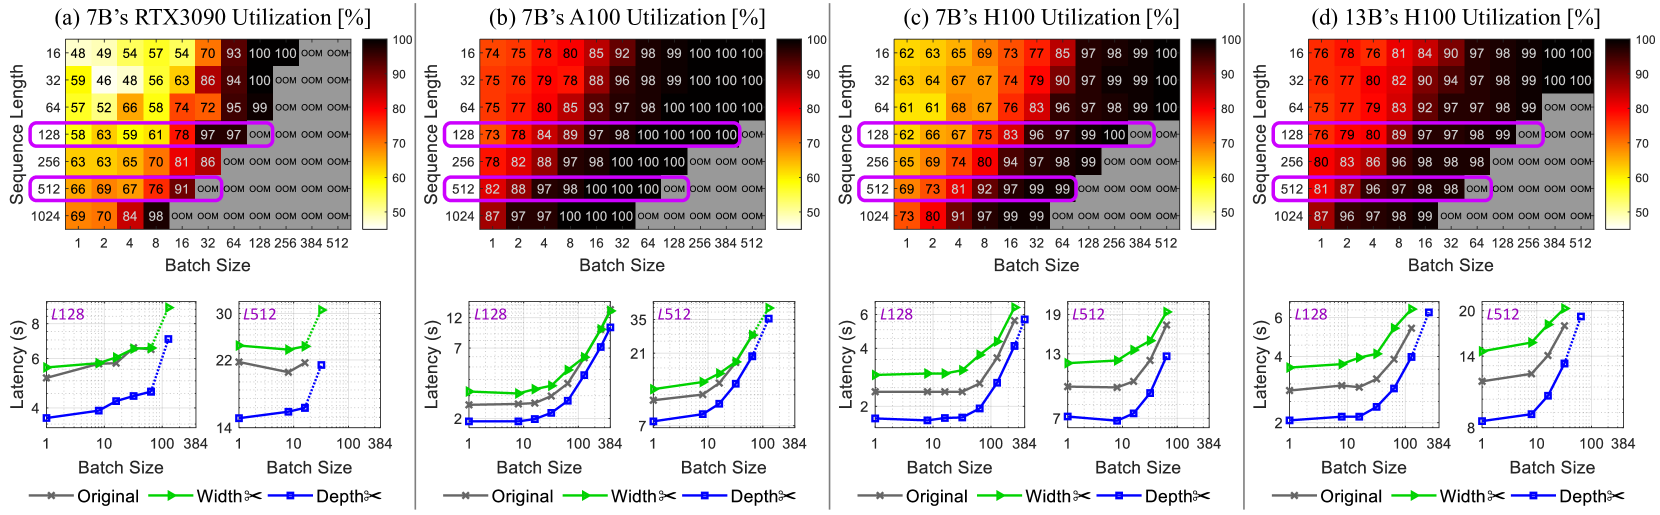
The image contains four heatmaps (a-d) and corresponding line graphs, analyzing GPU utilization and latency for different model configurations (7B and 13B parameter sizes) across sequence lengths and batch sizes. Heatmaps show utilization percentages, while line graphs compare latency for "Original," "Width," and "Depth" configurations.
---
### Components/Axes
#### Heatmaps (a-d)
- **X-axis**: Batch Size (1, 2, 4, 8, 16, 32, 64, 128, 256, 384, 512)
- **Y-axis**: Sequence Length (16, 32, 64, 128, 256, 512, 1024)
- **Color Scale**: Utilization (%) from 50% (yellow) to 100% (red)
- **Labels**:
- (a) 7B’s RTX3090 Utilization [%]
- (b) 7B’s A100 Utilization [%]
- (c) 7B’s H100 Utilization [%]
- (d) 13B’s H100 Utilization [%]
#### Line Graphs (a-d)
- **X-axis**: Batch Size (1, 10, 100, 384)
- **Y-axis**: Latency (s)
- **Legends**:
- Gray: Original
- Green: Width
- Blue: Depth
- **Annotations**:
- (a) L128, L512
- (b) L128, L512
- (c) L128, L512
- (d) L128, L512
---
### Detailed Analysis
#### Heatmaps
1. **7B’s RTX3090 (a)**:
- Utilization peaks at 100% for sequence length 1024 and batch size 512.
- Lower utilization (50-70%) for smaller batch sizes (1-16) and sequence lengths (16-64).
- High utilization (90-100%) dominates larger batch sizes (32-512) and sequence lengths (128-1024).
2. **7B’s A100 (b)**:
- Similar trend to RTX3090 but with slightly lower utilization (90-100%) at sequence length 1024 and batch size 512.
- Higher utilization (95-100%) for sequence length 512 and batch sizes ≥32.
3. **7B’s H100 (c)**:
- Near-100% utilization across all sequence lengths ≥128 and batch sizes ≥32.
- Lower utilization (60-80%) for smaller batch sizes (1-16) and sequence lengths (16-64).
4. **13B’s H100 (d)**:
- Consistently high utilization (80-100%) for sequence lengths ≥32 and batch sizes ≥8.
- Max utilization (100%) at sequence length 1024 and batch size 512.
#### Line Graphs
1. **7B’s RTX3090 (a)**:
- **L128**: Original (6s), Width (4.5s), Depth (2.5s) at batch size 32.
- **L512**: Original (22s), Width (18s), Depth (12s) at batch size 384.
2. **7B’s A100 (b)**:
- **L128**: Original (7s), Width (5s), Depth (3s) at batch size 32.
- **L512**: Original (21s), Width (16s), Depth (10s) at batch size 384.
3. **7B’s H100 (c)**:
- **L128**: Original (6s), Width (4s), Depth (2s) at batch size 32.
- **L512**: Original (13s), Width (9s), Depth (5s) at batch size 384.
4. **13B’s H100 (d)**:
- **L128**: Original (14s), Width (10s), Depth (6s) at batch size 32.
- **L512**: Original (20s), Width (14s), Depth (8s) at batch size 384.
---
### Key Observations
1. **Utilization Trends**:
- Larger models (13B) achieve higher utilization than smaller models (7B) across most configurations.
- H100 GPUs consistently outperform RTX3090 and A100 in utilization, especially for large sequence lengths and batch sizes.
2. **Latency Trends**:
- "Depth" configuration reduces latency by ~30-50% compared to "Original" across all models.
- "Width" configuration shows intermediate latency reduction (~20-40%).
- Latency increases with batch size, but optimized configurations (Width/Depth) scale more efficiently.
3. **Anomalies**:
- 13B’s H100 (d) shows near-100% utilization even at sequence length 32 and batch size 8, suggesting superior hardware efficiency.
- RTX3090 (a) has the lowest utilization (50-70%) for small batch sizes, indicating underutilization.
---
### Interpretation
1. **Hardware Efficiency**:
- H100 GPUs demonstrate significantly higher utilization than RTX3090 and A100, particularly for large models (13B). This suggests H100 is optimized for high-throughput workloads.
2. **Model Optimization**:
- "Depth" configuration reduces latency more effectively than "Width," likely due to architectural improvements in parallelism or memory access.
- Optimized configurations (Width/Depth) maintain high utilization while reducing latency, critical for real-time applications.
3. **Scalability**:
- Larger batch sizes and sequence lengths improve utilization but increase latency. However, optimized models mitigate this trade-off, enabling efficient scaling.
4. **Practical Implications**:
- For 7B models, H100 GPUs are ideal for high-throughput tasks, while RTX3090 may struggle with underutilization at small batch sizes.
- 13B models on H100 achieve near-maximal utilization, making them suitable for large-scale inference or training.
---
### Spatial Grounding and Color Matching
- **Legends**: Positioned below line graphs, with colors matching data points (gray=Original, green=Width, blue=Depth).
- **Heatmap Colors**: Red shades indicate high utilization (90-100%), yellow shades low utilization (50-70%).
- **Annotations**: Purple boxes highlight specific sequence lengths (L128, L512) in heatmaps.
---
### Conclusion
The data demonstrates that H100 GPUs outperform other hardware in utilization, especially for larger models. Optimized configurations ("Depth") reduce latency without sacrificing utilization, highlighting the importance of architectural improvements in model efficiency.