## Line Chart: Accuracy vs. Step for RLVR, RLME, and RLME-NoCheat
### Overview
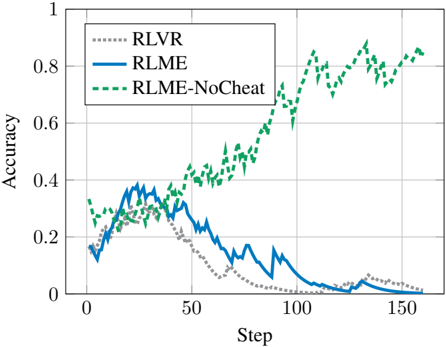
This chart illustrates the performance, measured as "Accuracy," of three distinct reinforcement learning methods—RLVR, RLME, and RLME-NoCheat—across a training duration of approximately 160 steps. The chart demonstrates a clear divergence in performance between the "NoCheat" variant and the other two methods.
### Components/Axes
* **Y-Axis:** Labeled "Accuracy," representing a normalized scale from 0 to 1.0.
* **X-Axis:** Labeled "Step," representing the training progression from 0 to 160.
* **Legend:** Positioned in the top-left quadrant of the chart area.
* **RLVR:** Represented by a grey dotted line.
* **RLME:** Represented by a solid blue line.
* **RLME-NoCheat:** Represented by a dashed green line.
### Detailed Analysis
The chart displays three distinct data series plotted against the axes:
1. **RLVR (Grey Dotted Line):**
* **Trend:** Starts at ~0.15, rises to a peak of ~0.3 at step 25, then exhibits a steady, consistent decline.
* **Values:** By step 75, accuracy drops to ~0.1. By step 120, it approaches 0.0, with a minor, transient spike to ~0.05 at step 130 before returning to near 0.0 by step 160.
2. **RLME (Solid Blue Line):**
* **Trend:** Starts at ~0.15, rises to a peak of ~0.4 at step 25 (the highest initial peak of the three). Following this peak, it trends downward with significant volatility.
* **Values:** It exhibits a sharp drop-off, with notable, jagged spikes at step 90 (~0.15) and step 125 (~0.05). It trends toward 0.0 by step 160.
3. **RLME-NoCheat (Dashed Green Line):**
* **Trend:** Starts at ~0.3, dips slightly to ~0.25 at step 15, and then initiates a strong, sustained upward trend.
* **Values:** It crosses the 0.4 threshold at step 50, the 0.6 threshold at step 90, and the 0.8 threshold at step 130. It finishes at approximately 0.85 at step 160.
### Key Observations
* **Early Convergence:** All three methods show similar performance characteristics between steps 0 and 30, with RLME and RLVR peaking around step 25.
* **Divergence:** After step 30, the RLME-NoCheat method diverges significantly from the other two, showing a positive slope, while RLVR and RLME show negative slopes.
* **Failure Modes:** Both RLVR and RLME appear to fail to converge or maintain accuracy, trending toward zero as the step count increases.
* **Volatility:** The RLME (solid blue) line is the most volatile, showing frequent, sharp fluctuations compared to the smoother decline of the RLVR (grey dotted) line.
### Interpretation
The data suggests that the "NoCheat" variant is the only successful approach among the three tested. The naming convention "NoCheat" implies that the other two methods (RLVR and RLME) may be relying on "cheating"—likely utilizing privileged information or shortcuts during training that do not generalize to the task, leading to eventual performance collapse.
The fact that RLVR and RLME peak early and then decline suggests they may be overfitting to initial conditions or failing to learn a robust policy. Conversely, the RLME-NoCheat method demonstrates a successful learning curve, indicating that removing the "cheating" mechanism allows the agent to learn the underlying task effectively, resulting in high accuracy by the end of the training period.