\n
## Line Chart: Accuracy vs. Step for RL Algorithms
### Overview
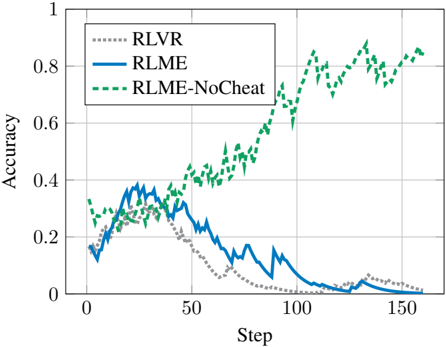
This image presents a line chart illustrating the accuracy of three reinforcement learning (RL) algorithms – RLVR, RLME, and RLME-NoCheat – over a series of steps. The chart displays how the accuracy of each algorithm changes as the number of steps increases.
### Components/Axes
* **X-axis:** Labeled "Step", ranging from approximately 0 to 160.
* **Y-axis:** Labeled "Accuracy", ranging from 0 to 1.
* **Legend:** Located in the top-left corner, identifying the three data series:
* RLVR (represented by a gray dotted line)
* RLME (represented by a blue solid line)
* RLME-NoCheat (represented by a green dashed line)
* **Gridlines:** Horizontal and vertical gridlines are present to aid in reading values.
### Detailed Analysis
* **RLVR (Gray Dotted Line):** The line starts at approximately 0.1 accuracy at Step 0. It initially increases slightly, reaching a peak of around 0.15 at Step 10. After Step 10, the accuracy declines steadily, approaching 0 by Step 150. The trend is generally downward.
* **RLME (Blue Solid Line):** The line begins at approximately 0.15 accuracy at Step 0. It increases to a peak of around 0.4 at Step 20. From Step 20 to Step 80, the accuracy decreases, reaching a low of approximately 0.05 at Step 80. After Step 80, the accuracy increases again, reaching approximately 0.35 at Step 150. The trend is initially upward, then downward, and finally upward again.
* **RLME-NoCheat (Green Dashed Line):** The line starts at approximately 0.3 accuracy at Step 0. It increases steadily, reaching approximately 0.8 accuracy at Step 150. The trend is consistently upward.
Specific Data Points (approximate):
| Step | RLVR (Accuracy) | RLME (Accuracy) | RLME-NoCheat (Accuracy) |
|---|---|---|---|
| 0 | 0.1 | 0.15 | 0.3 |
| 10 | 0.15 | 0.3 | 0.35 |
| 20 | 0.1 | 0.4 | 0.45 |
| 50 | 0.05 | 0.2 | 0.55 |
| 80 | 0.02 | 0.05 | 0.65 |
| 100 | 0.01 | 0.2 | 0.75 |
| 150 | 0.0 | 0.35 | 0.8 |
### Key Observations
* RLME-NoCheat consistently outperforms both RLVR and RLME in terms of accuracy.
* RLVR exhibits a clear decline in accuracy over time.
* RLME shows an initial increase in accuracy, followed by a decrease, and then a subsequent increase. This suggests a period of learning followed by forgetting or instability, and then re-learning.
* The accuracy of RLME-NoCheat increases monotonically, indicating stable learning.
### Interpretation
The data suggests that the "NoCheat" modification significantly improves the performance of the RLME algorithm. The consistent upward trend of RLME-NoCheat indicates that it is effectively learning and improving its accuracy over time. The fluctuating accuracy of RLME suggests that the algorithm may be susceptible to instability or overfitting without the "NoCheat" modification. The declining accuracy of RLVR indicates that it is not effectively learning from the environment.
The "cheat" in RLME likely refers to some form of information leakage or shortcut that allows the algorithm to achieve higher initial accuracy but ultimately hinders its long-term learning capabilities. Removing the cheat (as in RLME-NoCheat) forces the algorithm to learn more robust and generalizable strategies, leading to better overall performance. The comparison highlights the importance of careful algorithm design and the potential pitfalls of relying on shortcuts or biased information during the learning process.