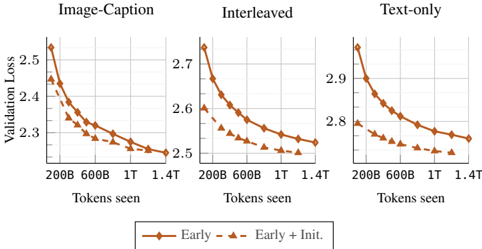
## Chart: Validation Loss vs. Tokens Seen for Different Training Methods
### Overview
The image presents three line charts comparing the validation loss of a model trained with different data interleaving methods (Image-Caption, Interleaved, and Text-only) against the number of tokens seen during training. Two training strategies are compared: "Early" and "Early + Init."
### Components/Axes
* **X-axis (horizontal):** "Tokens seen" with markers at 200B, 600B, 1T, and 1.4T.
* **Y-axis (vertical):** "Validation Loss" with a scale ranging from approximately 2.3 to 2.5 for "Image-Caption", 2.5 to 2.7 for "Interleaved", and 2.7 to 2.9 for "Text-only".
* **Titles:** "Image-Caption", "Interleaved", and "Text-only" are the titles for the three charts, respectively.
* **Legend (bottom):**
* Solid brown line with diamond markers: "Early"
* Dashed brown line with triangle markers: "Early + Init."
### Detailed Analysis
**1. Image-Caption Chart:**
* **Early (solid brown line, diamond markers):** The validation loss starts at approximately 2.5 and decreases to about 2.5 over the range of tokens seen.
* 200B: ~2.5
* 600B: ~2.35
* 1T: ~2.27
* 1.4T: ~2.25
* **Early + Init. (dashed brown line, triangle markers):** The validation loss starts at approximately 2.45 and decreases to about 2.25 over the range of tokens seen.
* 200B: ~2.45
* 600B: ~2.3
* 1T: ~2.27
* 1.4T: ~2.25
**2. Interleaved Chart:**
* **Early (solid brown line, diamond markers):** The validation loss starts at approximately 2.7 and decreases to about 2.52 over the range of tokens seen.
* 200B: ~2.72
* 600B: ~2.6
* 1T: ~2.55
* 1.4T: ~2.52
* **Early + Init. (dashed brown line, triangle markers):** The validation loss starts at approximately 2.6 and decreases to about 2.5 over the range of tokens seen.
* 200B: ~2.6
* 600B: ~2.53
* 1T: ~2.5
* 1.4T: ~2.5
**3. Text-only Chart:**
* **Early (solid brown line, diamond markers):** The validation loss starts at approximately 2.92 and decreases to about 2.75 over the range of tokens seen.
* 200B: ~2.92
* 600B: ~2.85
* 1T: ~2.78
* 1.4T: ~2.75
* **Early + Init. (dashed brown line, triangle markers):** The validation loss starts at approximately 2.8 and decreases to about 2.7 over the range of tokens seen.
* 200B: ~2.8
* 600B: ~2.75
* 1T: ~2.72
* 1.4T: ~2.7
### Key Observations
* In all three charts, the "Early" training strategy consistently shows a higher validation loss compared to the "Early + Init." strategy across all token counts.
* The validation loss decreases as the number of tokens seen increases for both training strategies in all three charts.
* The "Text-only" chart exhibits the highest validation loss values compared to the "Image-Caption" and "Interleaved" charts.
* The "Image-Caption" chart exhibits the lowest validation loss values compared to the "Interleaved" and "Text-only" charts.
* The rate of decrease in validation loss diminishes as the number of tokens seen increases, suggesting diminishing returns with more training data.
### Interpretation
The data suggests that initializing the model ("Early + Init.") leads to a lower validation loss compared to training from scratch ("Early"). This indicates that pre-training or using a good initialization point can improve model performance.
The different data interleaving methods ("Image-Caption", "Interleaved", "Text-only") impact the validation loss. "Image-Caption" results in the lowest validation loss, suggesting that incorporating image captions during training is beneficial. "Text-only" results in the highest validation loss, implying that relying solely on text data might not be as effective.
The decreasing validation loss with increasing tokens seen demonstrates that the model learns as it is exposed to more data. However, the diminishing rate of decrease suggests that there is a point of diminishing returns, where adding more training data provides less significant improvements in performance.
The relative performance of the different training methods and data interleaving strategies can inform decisions about how to train the model most effectively.