## Line Charts: Validation Loss vs. Tokens Seen for Three Training Data Types
### Overview
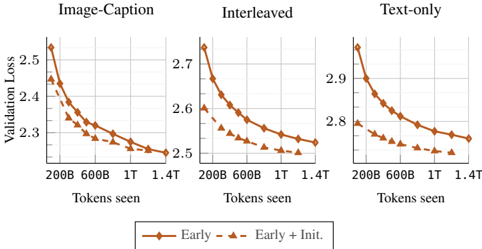
The image displays three side-by-side line charts comparing the validation loss of two model training approaches ("Early" and "Early + Init.") across three different training data configurations: "Image-Caption", "Interleaved", and "Text-only". Each chart plots validation loss on the y-axis against the number of training tokens seen on the x-axis. The overall trend shows decreasing validation loss as training progresses for all configurations, with the "Early + Init." approach consistently achieving lower loss.
### Components/Axes
* **Titles:** Three chart titles are positioned at the top center of each respective plot: "Image-Caption" (left), "Interleaved" (center), and "Text-only" (right).
* **Y-Axis (Vertical):** Labeled "Validation Loss" on the far left, applying to all three charts. Each chart has its own independent scale:
* **Image-Caption:** Scale ranges from approximately 2.25 to 2.55.
* **Interleaved:** Scale ranges from approximately 2.5 to 2.75.
* **Text-only:** Scale ranges from approximately 2.75 to 2.95.
* **X-Axis (Horizontal):** Labeled "Tokens seen" at the bottom of each chart. Major tick marks are consistently placed at 200B, 600B, 1T, and 1.4T (B = Billion, T = Trillion).
* **Legend:** Positioned centrally below all three charts. It defines two data series:
* **Early:** Represented by a solid brown line with circular markers.
* **Early + Init.:** Represented by a dashed brown line with triangular markers.
### Detailed Analysis
**Chart 1: Image-Caption (Left)**
* **Trend Verification:** Both lines show a steep, concave-upward decreasing trend that flattens as tokens increase. The "Early + Init." line is consistently below the "Early" line.
* **Data Points (Approximate):**
* **Early (Solid/Circle):** Starts at ~2.52 (200B), drops to ~2.35 (600B), ~2.28 (1T), ends at ~2.26 (1.4T).
* **Early + Init. (Dashed/Triangle):** Starts at ~2.46 (200B), drops to ~2.32 (600B), ~2.27 (1T), ends at ~2.25 (1.4T).
**Chart 2: Interleaved (Center)**
* **Trend Verification:** Similar decreasing, flattening trend for both lines. The performance gap between the two approaches is more pronounced here than in the first chart.
* **Data Points (Approximate):**
* **Early (Solid/Circle):** Starts at ~2.72 (200B), drops to ~2.62 (600B), ~2.57 (1T), ends at ~2.55 (1.4T).
* **Early + Init. (Dashed/Triangle):** Starts at ~2.60 (200B), drops to ~2.55 (600B), ~2.52 (1T), ends at ~2.50 (1.4T).
**Chart 3: Text-only (Right)**
* **Trend Verification:** Both lines decrease, but the curves are less steep compared to the other charts, indicating slower improvement. The "Early + Init." line maintains a clear advantage.
* **Data Points (Approximate):**
* **Early (Solid/Circle):** Starts at ~2.92 (200B), drops to ~2.85 (600B), ~2.82 (1T), ends at ~2.80 (1.4T).
* **Early + Init. (Dashed/Triangle):** Starts at ~2.82 (200B), drops to ~2.78 (600B), ~2.76 (1T), ends at ~2.75 (1.4T).
### Key Observations
1. **Consistent Superiority of Initialization:** In all three data regimes, the "Early + Init." method (dashed line) results in lower validation loss at every measured point compared to the "Early" method (solid line).
2. **Data Type Impact on Loss Magnitude:** The absolute validation loss values are highest for "Text-only" training (starting >2.9) and lowest for "Image-Caption" training (starting ~2.5). "Interleaved" data sits in the middle.
3. **Diminishing Returns:** All curves show the most significant loss reduction in the early stages of training (before 600B tokens), with the rate of improvement slowing considerably between 1T and 1.4T tokens.
4. **Relative Improvement:** The performance gap (vertical distance between the two lines) appears most significant in the "Interleaved" chart and least significant in the "Image-Caption" chart at the final measured point.
### Interpretation
This data demonstrates the effectiveness of an initialization technique ("Init.") when applied to an "Early" training schedule across diverse multimodal and text-only training data. The key finding is that this initialization provides a consistent and lasting performance benefit, reducing validation loss regardless of whether the model is trained on image-caption pairs, interleaved image-text data, or text alone.
The variation in absolute loss values suggests that the task or evaluation benchmark used is inherently more challenging for models trained purely on text ("Text-only") compared to those exposed to visual information ("Image-Caption", "Interleaved"). The "Interleaved" format, which likely involves more complex sequencing, shows an intermediate difficulty.
The flattening curves indicate that by 1.4 trillion tokens, the models are approaching convergence for this specific training setup and evaluation metric. The persistent gap between the lines implies that the advantage conferred by the initialization is not overcome by simply training the baseline model for longer within this range. This suggests the initialization helps the model find a better optimization path or starting point in the loss landscape from the very beginning of training.